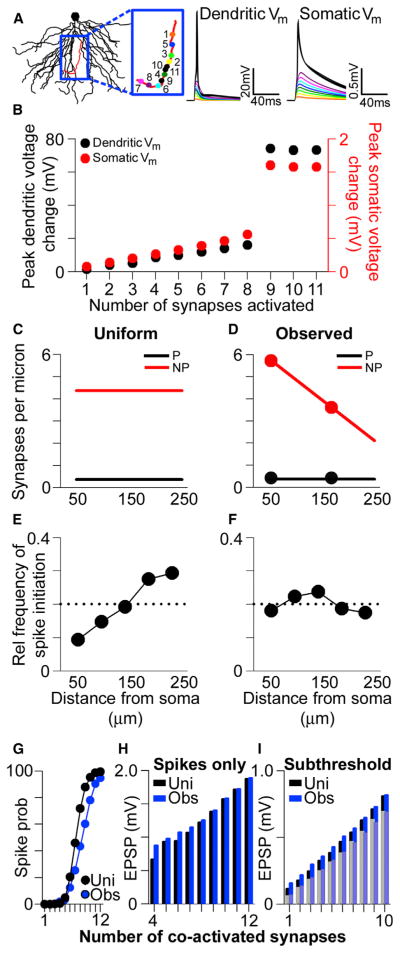
Figure 5. Location-Independent Contribution of Synapses to Dendritic Spike Initiation and Maximized Dendritic Impact at the Soma.
(A) The basal dendrites of a reconstructed CA1 pyramidal neuron. Voltage traces show the simulated local (left) and somatic (right) membrane potential (Vm) in response to iterative simultaneous activation of synaptic conductances, whose locations are shown in the blue box. Color-coded voltage traces derive from the iterative activation protocol; i.e., the voltage trace in response to conductance activation at “1” is depicted in orange, the voltage trace in response to simultaneous conductance activation at both “1” and “2” is depicted in yellow, etc.
(B) Peak dendritic- (black) and somatic- (red) simulated voltage change in response to simultaneous activation of progressively higher numbers of synaptic conductances. Note the nonlinear nature of the voltage change as the number of activated conductances increases.
(C) Synapse density per unit length of dendrite in the uniform case for simulated perforated (black) and nonperforated (red) synapses.
(D) Synapse density scaled according to experimentally observed values. Superimposed circles represent the density obtained from experimental values in pSO and dSO, by multiplying the spine density data in Figure 1 by the proportion of nonperforated and perforated synapses from Figure 2.
(E) Plot showing the relative probability that a dendritic spike is generated by a synapse placed at a given location along the length of an individual dendrite, using the uniform conductance values shown in Figure 4B and uniform synapse densities shown in (C). Data are aggregated from 900 simulations containing both perforated and nonperforated synapses. The dashed line represents the uniform, or completely distance independent, probability.
(F) Same as (E) but with experimentally observed synaptic conductance values (Figure 4F) and synapse densities (D).
(G) The probability of triggering a dendritic spike as a function of the number of coactivated synapses in the simulations using uniform values (black) or experimentally observed values (blue).
(H) The average somatic EPSP on simulation trials where the local EPSP exceeded the threshold for triggering a dendritic spike for simulations using uniform (black) or experimentally observed (blue) values.
(I) Same as (H) but for trials on which the local EPSP failed to trigger a dendritic spike. Bars in the background derive from trials in which a perforated synapse was activated; superimposed, lightened bars are from trials in which only nonperforated synapses were activated.

