
Figure 5. DNA methylation levels at metastable and imprinted loci.
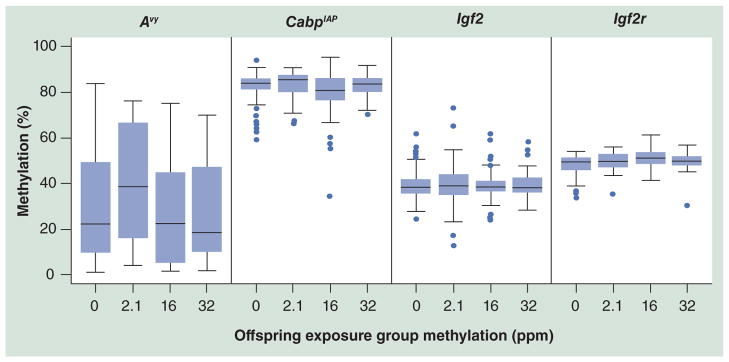
Day 22 tail tissue methylation assayed via pyrosequencing reveals a cubic trend of methylation in Avy (p = 0.04; all Avy animals) and CabpIAP (p = 0.01; all Avy/a and a/a [wild-type] animals) loci, resulting in an increased methylation level at the 2.1 ppm level and decreased methylation at higher levels. The imprinted loci, Igf2 and Igf2r, do not show a significant shift in methylation levels across dosage in either linear or cubic trends for any subgroup of animals, suggesting that methylation response is dependent on the genetic features at each locus. Avy naturally exhibits a wide range of variation from near 0 to 85% in this population, and the range is slightly reduced as dosage increases. By contrast, CabpIAP has a smaller range and higher median methylation. The dots represent outliers.
Avy: Viable yellow agouti; CabpIAP: CDK5 activator-binding protein intracisternal A particle element.