Abstract
Current state-of-art whole-body PET scanners achieve a system spatial resolution of 4–5 mm with limited sensitivity. Since the reconstructed spatial resolution and image quality are limited by the count statistics, there has not been a significant push for developing higher resolution whole-body PET scanners. Our goal in this study is to investigate the impact of improved spatial resolution together with time-of-flight (TOF) capability on lesion uptake estimation and lesion detectability, two important tasks in whole-body oncologic studies. The broader goal of this project is the development of a new state-of-art TOF PET scanner operating within an MRI while pushing the technology in PET system design. We performed Monte Carlo simulations to test the effects of crystal size (4 mm and 2.6 mm wide crystals), TOF timing resolution (300ps and 600ps), and 2-level depth-of-interaction (DOI) capability. Spatial resolution was calculated by simulating point sources in air at multiple positions. Results show that smaller crystals produced improved resolution, while degradation of resolution due to parallax error could be reduced with a 2-level DOI detector. Lesion phantoms were simulated to measure the contrast recovery coefficient (CRC) and area under the LROC curve (ALROC) for 0.5 cm diameter lesions with 6:1 activity uptake relative to the background. Smaller crystals produce higher CRC, leading to increased ALROC values or a reduction in scan time. Improved timing resolution provides faster CRC convergence and once again leads to an increase in ALROC value or reduced scan time. Based on our choice of timing resolution and crystal size, improved timing resolution (300ps) with larger crystals (4 mm wide) has similar ALROC as smaller crystals (2.6 mm wide) with 600ps timing resolution. A 2-level DOI measurement provides some CRC and ALROC improvement for lesions further away from the center, leading to a more uniform performance within the imaging field-of-view (FOV). Given a choice between having either an improved spatial resolution, improved timing resolution, or DOI capability, improved spatial or timing resolution provide an overall higher ALROC relative to a 2-level DOI detector.
Index Terms: contrast, DOI, lesion detection, spatial resolution, timing resolution, TOF
I. Introduction
Current state-of-art whole-body PET scanners achieve a system spatial resolution of 4–5 mm with a total system sensitivity of 5–8%. The choice of a 4–5 mm spatial resolution is driven primarily by the idea that for improved spatial resolution, increased counts are needed to maintain similar image noise levels [1]. Since the intrinsic sensitivity of modern PET scanners is limited by the cost of scintillator material, there has not been a significant push for developing whole-body PET scanners with higher intrinsic detector resolution. In a well-known simulation study [2], however, it was shown that for high contrast objects/lesions the increase in contrast due to improved spatial resolution leads to a reduction in the number of counts needed to produce images of same visual quality. Therefore, we have initiated this Monte Carlo study to determine the effects of spatial resolution versus sensitivity using clinical metrics for image evaluation. In contrast to earlier studies our scanner designs are based on fully-3D, time-of-flight (TOF) PET scanners using modern scintillators and using an iterative image reconstruction algorithm. In addition, we also evaluate the impact of depth-of-interaction (DOI) measurement in the PET detector.
For this study, we will vary crystal cross-section, TOF timing resolution, and DOI capability while keeping the system geometry and crystal thickness (i.e. scanner sensitivity) fixed. Smaller crystal size as well as DOI measurement capability will lead to improved spatial resolution, while improved timing resolution has been shown to improve noise characteristics in the reconstructed TOF images [3]. Our goal in this study is to investigate the impact of improved spatial resolution together with TOF capability on lesion uptake estimation and lesion detectability, two important tasks in whole-body oncologic studies. The broader goal of this project, which also helped motivate this study, is the development of a new state-of-art TOF PET scanner operating within an MRI while pushing the technology and detector performance in PET system design.
II. Materials
A. Simulated scanner geometry
We performed EGS4-based system simulations [4, 5] for a cylindrical PET scanner geometry with a ring diameter of 70 cm and an axial field-of-view (AFOV) of 18 cm using pixelated LSO crystals. The simulated scanner ring diameter was kept relatively small due to the broader scope of this work that requires the PET scanner to mechanically fit within the MR magnet. In this study, we investigated the effects of varying three scanner design parameters while keeping its diameter and axial length fixed: crystal cross-section size, timing resolution, and DOI capability. Simulated crystal sizes were 4.0 × 4.0 × 20 mm3 and 2.6 × 2.6 × 20 mm3 and TOF information was modeled with either 300ps or 600ps timing resolution. The crystal pitch was simulated to be 4.07 mm and 2.67 mm for the two crystal sizes, leading to system packing fractions of 97% and 95%, respectively. This difference in packing fraction leads to a < 5% lower sensitivity for the scanner using 2.6 mm wide crystals versus the scanner using 4.0 mm wide crystals.
The choice of crystal size and timing resolution was driven by similarity to what is commercially available in whole-body PET scanners (4 mm wide crystal and a timing resolution of around 600ps), and the potential to use smaller crystals and/or the ability to achieve a 300ps timing resolution with LSO in an improved detector design [6, 7]. Scanner geometries with DOI capability were modeled with two 10 mm layers (2-level DOI) while non-DOI capable scanners were modeled with a single 20 mm layer. The choice of 2-level DOI capable scanners is also in keeping with practical detector designs that have demonstrated the ability for such a measurement [8–11]. To study both the individual and combined effects of these three variables, eight scanner geometries were therefore simulated.
B. Simulated phantoms
To verify our understanding of the effect of varying crystal size and DOI, we first performed a spatial resolution study by simulating point sources in air at radial positions of r = 0, 2, 5, 10, and 15 cm. It is important to note that spatial resolution measured in this way is an ideal case that we use to illustrate the effects of smaller crystals and DOI.
To evaluate the impact of our scanner design choice on lesion quantification and detectability, a cylindrical lesion phantom was simulated for all eight scanner geometries. The lesion phantom is a 35 cm diameter × 19 cm long water filled cylinder containing sixteen 0.5 cm diameter lesions, respectively. Lesions were distributed at two radial positions, 7 cm and 14 cm, and at two geometrically symmetric axial positions, AFOV/4 and -AFOV/4 with a 6:1 uptake relative to the background (see Fig. 1). The choice of having lesions in two off-center slices was done for convenience since it cuts down the number of simulations into half. However, since the simulation uses a single bed position, the two slices while having equal sensitivity, will have a sensitivity that is half that of a clinical multi-bed data acquisition. We also simulated a 35 cm diameter × 19 cm long uniform water-filled phantom with an activity concentration that is the same as the lesion phantom background. In order to perform statistical analysis, five independent runs were simulated for each of the lesion phantom and uniform phantom for all eight geometries. Each simulated data set was modeled to replicate a 3 minutes single bed position data acquisition assuming an activity concentration of 0.1 uCi/cc of 18F-FDG. Note that clinically we routinely inject 15 mCi of 18F-FDG in the patient and start scans after a 60 minutes uptake period, corresponding to an activity concentration of about 0.15 uCi/cc in a 70 kg patient at the start if the PET scan. All simulated data were stored in list-mode form with TOF information.
Fig. 1.
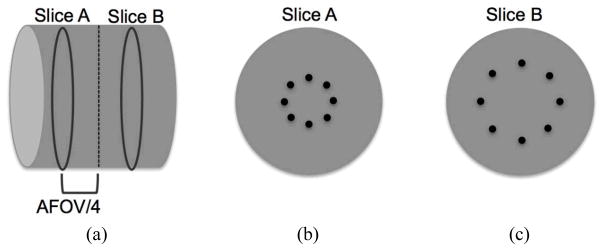
Schematic of the simulated lesion phantom. (a) Axial view of the 35 cm diameter × 19 cm long phantoms with hot spheres distributed in Slices A and B at axial positions of AFOV/4 and -AFOV/4. (b) Slice A containing eight spheres at a radial position of 7 cm. (c) Slice B containing eight spheres at a radial position of 14 cm. All spheres are 0.5 cm in diameter and have an activity uptake of 6:1 with respect to the background.
C. Image reconstruction
Spatial resolution images were generated by re-binning the point source in air list-mode data into a linearly-interpolated sinogram and reconstructing with a 3D-FRP algorithm [12], which is a direct 3D Fourier reconstruction method with Fourier reprojection. Lesion and uniform phantom images were reconstructed with an optimized blob-based, list-mode OSEM algorithm [13] with Gaussian TOF kernel, 25 subsets, with normalization, attenuation, and scatter corrections built into the system model [14]. The overall list-mode TOF reconstruction approach is very similar to the commercial implementation by Philips [15]. Normalization data were generated by performing uniform phantom simulations (40 cm diameter × 19 cm length) with very high count statistics, while the attenuation images were generated using analytical calculation. Scatter estimation was performed using a TOF-extended single scatter correction [16] that is similar to the one proposed by Watson [17] and implemented by both Philips and Siemens. No point spread function (PSF) modeling was performed in the image reconstruction for this study. Reconstructed images were generated in 2 × 2 × 2 mm3 voxels. The lesion and uniform phantom list files were reconstructed for the full 3 minutes data acquisition simulation as well as for a partial 2 minutes data acquisition.
D. Image analysis
Spatial resolution was measured using the 3D-FRP reconstructed images of point source in air using NEMA NU2-2001 analysis [18]. Lesion uptake estimation was performed using the contrast recovery coefficient (CRC) metric. CRC was calculated for each sphere in the lesion phantom by using a circular region-of-interest (ROI) drawn over the center of that sphere (5 mm diameter) to estimate the count density, CH,j, in the j-th sphere as determined by the mean number of counts in the ROI. The mean counts within a circular ROI were estimated by sub-sampling each 2×2×2 mm3 image voxel overlapping with the ROI into 10×10×10 sub-voxels, calculating the fraction of sub-voxels lying within the ROI, and weighting the number the counts in each image voxel within the ROI by this fraction of sub-voxels. Similarly, background count density, CB,j, was determined as the mean number of counts in a circular ROI drawn at the sphere location in a slice axially opposite to the slice containing the sphere. The CRCj for j-th sphere was calculated according to the NEMA NU2-2001 definition [18]:
where ‘uptake’ is the simulated lesion contrast value (6). The CRC is then reported as an average over all 16 spheres.
Lesion detectability for the lesion phantoms was estimated using a generalized scan statistics model [19] where a local contrast over multiple lesions in the lesion phantom images (five replicates) was calculated and the distribution fitted to a Gaussian to estimate the lesion contrast probability density function (pdf). Local contrast distribution for noise nodules was calculated by scanning the uniform cylinder images (five replicates). A Gaussian fit to the tails of the local contrast distribution for noise nodules is then used to estimate the pdf of the noise nodule contrast as described in [19]. The two pdfs can be used to generate the ROC and LROC curves. For our analysis we chose to calculate the area under the LROC curve (ALROC) as the metric for lesion detection and localization since the primary difference in our different scanner designs is count statistics. ALROC values were calculated for the different scanner geometries and timing resolutions a function of the number of reconstruction iterations. The error in the ALROC value was determined as the standard deviation of the results over the 200 bootstrap data sets. We determined that the iteration number for achieving maximum ALROC did not vary with crystal size or DOI measurement capability, and was defined only by the TOF timing resolution. From our results we concluded that the maximum ALROC values are reached after iteration numbers 4 and 8 for scanners with timing resolution of 300ps and 600ps, respectively. All results shown here are therefore for this choice of iteration numbers.
III. Results
A. Spatial resolution with point source
Fig. 2 shows the transverse spatial resolution (FWHM) measurements for both crystal sizes, with and without DOI capability. All analysis was performed according to NEMA NU2-2001. As expected, smaller crystals yield improved spatial resolution, while parallax error leads to a degradation of resolution as the point source is moved out radially. With 2-level DOI, the effects of parallax error are reduced.
Fig. 2.
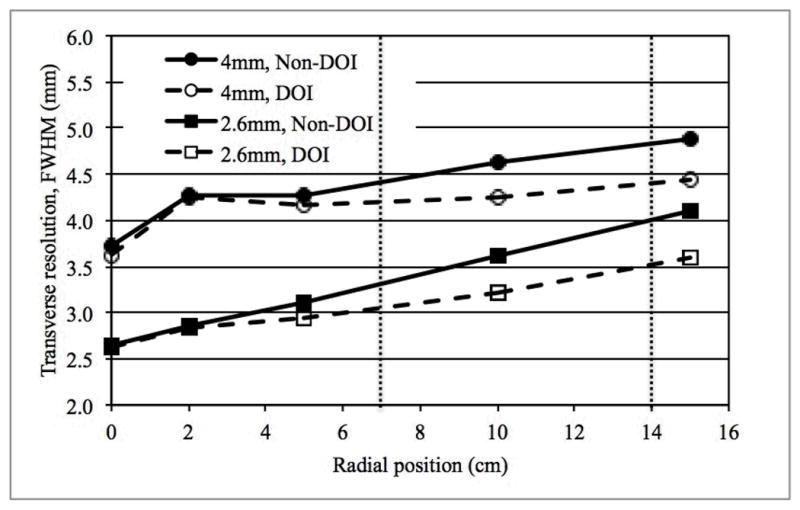
Average transverse spatial resolution (FWHM) for scanners using two different crystal sizes, and with or without 2-level DOI measurement. Data were reconstructed using the 3D-FRP reconstruction algorithm. The two vertical dotted lines indicate the locations of lesions in slices A and B, respectively, of the lesion phantom.
B. Lesion phantom
Fig. 3 shows representative (one of five replicates) transverse image slices containing lesions at r=7 cm and r=14 cm for selected scanner designs. The images at the extreme left represent a configuration very similar to the current generation of PET scanners (4 mm wide crystals, Non-DOI, 600ps timing resolution), while the images at the extreme right are for a technologically advanced scanner with smaller (2.6 mm wide) crystals, 2-level DOI information, and 300ps timing resolution. These images are for 3 minutes scan time.
Fig. 3.
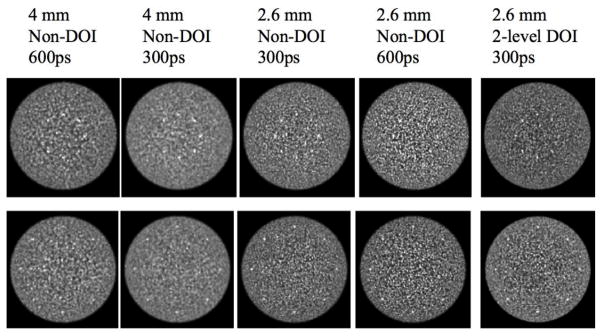
Transverse image slices for selected scanner designs. Images are for a 3 minutes scan and the lesions are 0.5 cm in diameter with a 6:1 uptake with respect to the background. The top row shows lesions at r = 7 cm (Slice A) while the bottom row is for lesions at r = 14 cm (Slice B).
1) Impact of spatial resolution
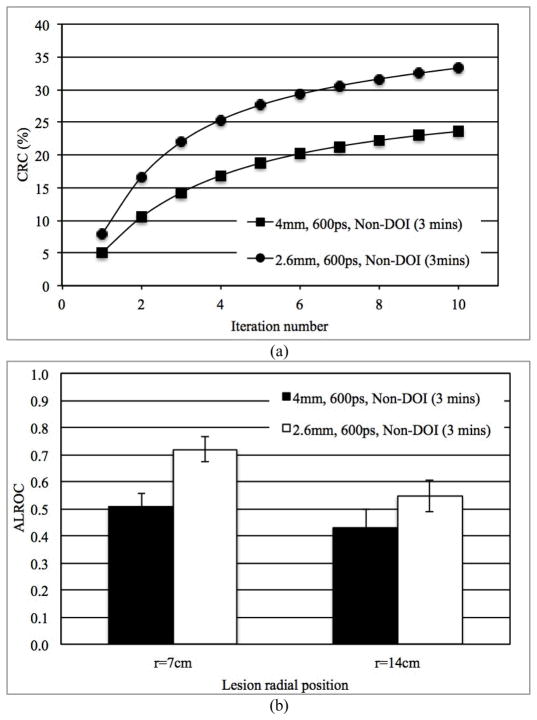
In Figs. 4a and 4b we show the measured CRC as a function of iteration number for lesions at r=14 cm and ALROC for lesions at both r=7 cm and r=14 cm, respectively, for scanners using 2.6 mm and 4 mm wide LSO crystals. These results are for 3 minutes scan time in scanners without any DOI information and 600ps timing resolution. Our results show improved CRC values and a correspondingly improved ALROC results for the scanner with smaller (2.6 mm wide) crystals (p < 0.05 for significance of ALROC difference). These conclusions also hold true for scanners with 2-level DOI information as well as improved timing resolution.
Fig. 4.
(a) Measured CRC for spheres in Slice B at a radial position of 14 cm and, (b) ALROC results for all spheres in scanners with two different crystal sizes. Results are shown for 600ps timing resolution and a detector without any DOI information (3 minutes scan time).
2) Impact of timing resolution
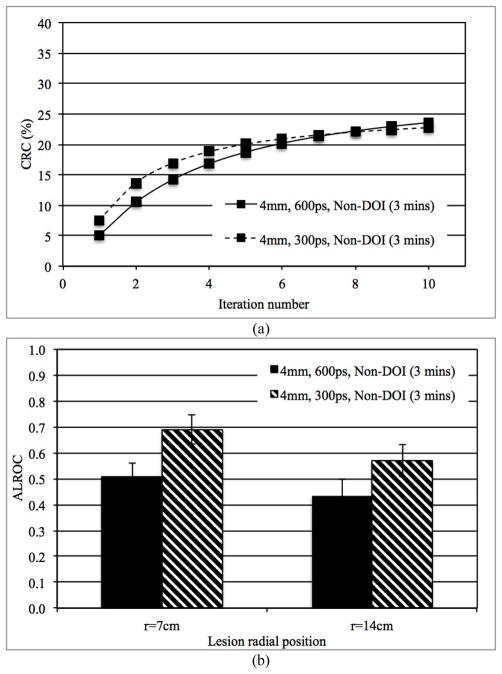
In Figs. 5a and 5b we show the measured CRC as a function of iteration number for lesions at r=14 cm and ALROC for lesions at both r=7 cm and r=14 cm, respectively, for scanners with 300ps and 600ps timing resolution. These results are for 3 minutes scan time in scanners without any DOI information and 4 mm wide crystals. Improved timing resolution leads to a faster convergence of lesion CRC versus iteration number, but to the same maximum CRC value. Consequently, improved CRC and noise characteristics lead to improved ALROC results for the scanner with 300ps timing resolution (p < 0.05 for significance of ALROC difference). These conclusions also hold true for scanners with 2-level DOI information as well as using smaller crystals.
Fig. 5.
(a) Measured CRC for spheres in Slice B at a radial position of 14 cm and, (b) ALROC results for all spheres in scanners with two different timing resolutions (300 and 600ps). Results are shown for scanners with 4 mm wide crystals and without any DOI information (3 minutes scan time).
3) Impact of DOI measurement
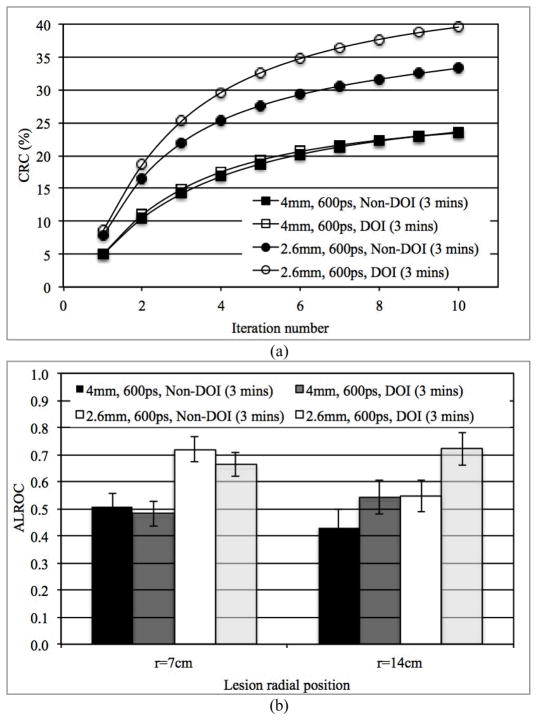
In Figs. 6a and 6b we show the measured CRC as a function of iteration number and ALROC, respectively, for scanners with and without DOI information. These results are for 3 minutes scan time in scanners using 2.6 mm and 4 mm wide crystals with a timing resolution of 600ps. Two-level DOI information improved CRC for lesions at r=14 cm in the 2.6 mm wide crystal system. No gain in CRC was observed for the lesions at r=14 cm in the 4 mm wide crystal system with 2-level DOI. The 2-level DOI information also leads to an ALROC improvement mainly for off-center (r=14 cm) lesions (p < 0.05 for significance of ALROC difference for lesions at r=14 cm). As a result, 2-level DOI information provides a more uniform ALROC performance over varying lesion radial positions. However, the overall gain in ALROC due to DOI information does not compensate for the gain arising due to improved spatial or timing resolutions (see Figs. 4b and 5b). These conclusions also hold true for scanners with 300ps timing resolution.
Fig. 6.
(a) Measured CRC for spheres in Slice B at a radial position of 14 cm and, (b) ALROC results for all spheres in scanners with two different crystal sizes and with or without DOI information. Results are shown for scanners with 600ps timing resolution and 3 minutes scan time.
4) Impact of spatial and timing resolutions
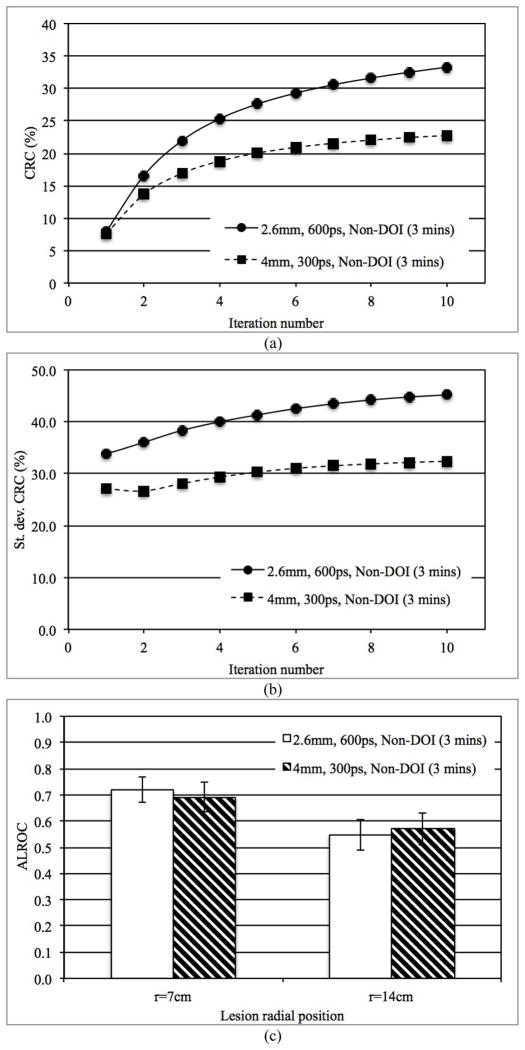
In Fig. 7a we show the CRC as a function of iteration number for lesions at r=14 cm for scanners using 4 mm wide crystals with 300ps timing resolution and scanners using 2.6 mm wide crystals with 600ps timing resolution. This combination of parameters is of practical interest since it is understood that small, long crystals can have poor timing resolution relative to larger crystals of the same length. From Fig. 7a we clearly see that the maximum CRC is higher for the scanner with 2.6 mm wide crystals. However, in Fig. 7b we plot the variation (standard deviation) in the CRC measured over multiple lesions (eight lesions per image * five images), which shows that better (300ps) timing resolution leads to a lower variability in the measured lesion CRC values and indicating reduced noise in the image. The ALROC results as shown in Fig. 7c are very similar for the two systems evaluated here (p=0.11 for r=7 cm and p=0.09 for r=14 cm lesions), indicating that the improved spatial resolution and CRC of the scanner with 2.6 mm wide crystal is balanced by the improved timing resolution of the scanner with 4 mm wide crystal which leads to a faster CRC convergence (less number of iterations).
Fig. 7.
(a) Measured CRC for spheres in Slice B at a radial position of 14 cm, (b) Variation (standard deviation) in measured CRC over statistical copies of spheres in Slice B, and (c) ALROC results for all spheres in two scanners with different combinations of crystal size and timing resolution. Results are shown for scanners without any DOI information and 3 minutes scan time.
5) Impact of improved spatial or timing resolution on scan time
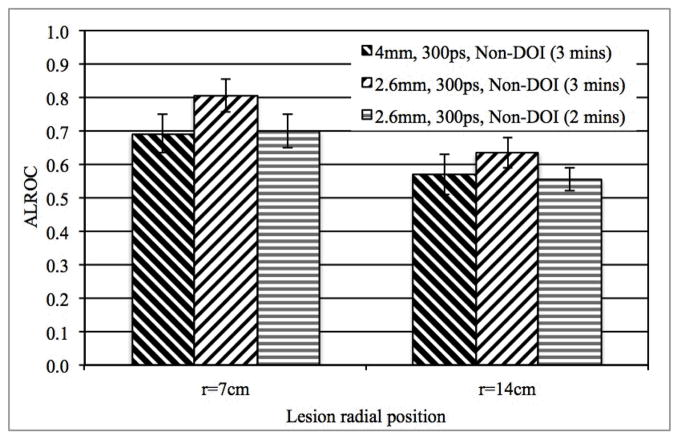
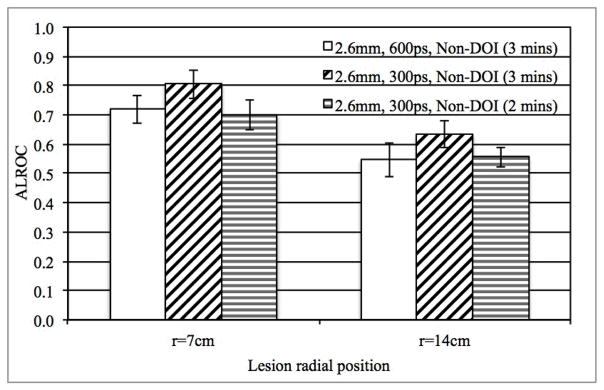
In Fig. 8 we plot the ALROC results for a 3 minutes scan in a scanner using 4 mm wide crystal and 3 and 2 minutes scan in a scanner with smaller, 2.6 mm wide crystals. The p-value is 1.00 (r=7 cm lesions) and 0.42 (r=14 cm lesions) when comparing the ALROC results from a 3 minutes scan in a scanner using 4 mm wide crystals and a 2 minutes scan in a scanner using 2.6 mm wide crystals. For all other comparisons of ALROC values, p < 0.05. Our results, therefore, show that in scanners using 2.6 mm wide crystals, scan time can be reduced to 2 minutes without any loss in ALROC values relative to a 3 minutes scan in a scanner using 4 mm wide crystal (scanner timing resolution is assumed to be unchanged).
Fig. 8.
ALROC results for all spheres in scanners with two different crystal sizes. Results are shown for 300ps timing resolution and a detector without any DOI information, while the scan time is changed.
In Fig. 9 we plot the ALROC results for a 3 minutes scan in a scanner with 600ps timing resolution and 3 and 2 minutes scan in a scanner with 300ps timing resolution. The p-value is 0.09 (r=7 cm lesions) and 0.40 (r=14 cm lesions) when comparing the ALROC results from a 3 minutes scan in a scanner with 600ps timing resolution and a 2 minutes scan in a scanner with 300ps timing resolution. For all other comparisons of ALROC values, p < 0.05. Our results, therefore, show that with improved timing resolution, scan time can be reduced to 2 minutes without any loss in ALROC values (crystal size is assumed to be unchanged).
Fig. 9.
ALROC results for all spheres in scanners with two different timing resolutions (300 and 600ps). Results are shown for scanners with 4 mm wide crystals and without any DOI information, while the scan time is changed
IV. Discussion and Conclusion
The benefit of improved spatial resolution that leads to increased lesion CRC in the reconstructed image cannot be directly compared to the benefit of improved system timing resolution that leads to a faster CRC convergence and hence different noise characteristics in the reconstructed image. Hence, for this work we chose to use the ALROC metric calculated with numerical observer to quantify a clinically relevant task of lesion detection and localization. While physical metrics such as spatial resolution or scanner sensitivity can provide a direct measure of individual scanner performance characteristics, they are limited in their ability to describe clinical performance of scanners that, for instance, have very different design trade-offs. We note that the use of a numerical observer to calculate the ALROC may not fully replicate the performance of a trained clinician.
In Figs. 4–7 we find that the CRC values continue to increase beyond iteration numbers 4 (300ps timing resolution data) and 8 (600ps timing resolution data), even though the ALROC values reach a maximum at these iteration numbers. While lesion detection will be maximized at these iteration values, the measured uptake for the lesion will be slightly smaller than the maximum value (< 10% in our work).
The results of our study (see Fig. 4) show that higher spatial resolution achieved by using smaller crystals in a PET detector not only leads to improved CRC estimation, but also an increased ALROC value for small (0.5 cm diameter) spheres or lesions. This result is achieved without increasing the scanner sensitivity or scan time, indicating the benefit of improved spatial resolution without a commensurate increase in the number of detected events. In fact, while keeping timing resolution constant we demonstrate (Fig. 8) that the scan time can be reduced from 3 minutes to 2 minutes with the use of smaller crystals without any loss in ALROC performance. These results are consistent with what was shown by Muehllehner [2] who showed that fewer counts are needed to achieve similar visual quality in images obtained from a system with higher spatial resolution. However, in [2] it was observed that a 2 mm improvement in spatial resolution led to a factor of four reduction in scan time or counts. The results from our work do not show such a large reduction in scan time due to improved spatial resolution. However, besides using a different metric for evaluation, our study simulates a fully-3D TOF scanner and uses an iterative image reconstruction algorithm, both of which can have an impact on the noise characteristics in the image. Also, while PSF modeling in image reconstruction was not used in this work, improved spatial resolution achieved using such techniques may not be equivalent to gains in ALROC achieved in a scanner with better intrinsic (detector) spatial resolution due to different image properties (such as noise) [20, 21]. A detailed evaluation of PSF modeling is beyond the scope of this work.
Improved TOF timing resolution leads to a faster convergence of sphere contrast (Fig. 5a), and hence an improved trade-off between contrast and noise in the image as a function of number of iterations of image reconstruction. The ALROC converges to a maximum value that is higher (Fig. 5b) and after less number of iterations as the timing resolution is improved from 600ps to 300ps. Alternately, we show that the improved performance with better (300ps) TOF timing resolution can be used to achieve similar ALROC as with a 600ps timing resolution system but with shorter scan times (see Fig. 9).
With a 2-level DOI measuring detector, parallax error in the scanner is reduced with a corresponding increase in the CRC value for off-center lesions (Fig. 6a). However, the benefit of DOI measurement is larger in a scanner using smaller crystals, since the relative impact of parallax error will be higher in a scanner with improved spatial resolution. Increased CRC for off-center lesion leads to an increased ALROC as well, and a more uniform performance for lesions at different radial positions (Fig. 6b). While a more uniform CRC measurement is desirable for quantification tasks, improved spatial or timing resolution still lead to an overall increase in ALROC as opposed to the addition of 2-level DOI information. Hence, if given a choice, for detectability tasks an improvement in detector spatial or timing resolution is more important then the addition of DOI information since the ALROC is similar or lower in a detector with DOI but with worse spatial or timing resolution (e.g. compare 2.6 mm, Non-DOI data with 4 mm, DOI data in Fig. 6b). The benefit of improved spatial or timing resolution over a DOI measurement capability is expected to be even higher in the standard PET scanners with 90 cm ring diameter (as opposed to 70 cm ring diameter that was simulated here) due to reduced parallax error.
Finally, given a choice between either an improved spatial or timing resolution, our choice of parameters (2.6 mm wide crystals with 600ps timing resolution versus 4 mm wide crystals with 300ps timing resolution) does not show any noticeable difference in the lesion detection and localization task performance (Fig. 7c). Although improved spatial resolution leads to a higher CRC estimation, this is accompanied by increased variability in the measured value (Figs. 7a and 7b). However, in certain high count statistics scenarios, the increased CRC estimate achieved with improved spatial resolution may be desirable (over improved timing resolution) since the overall statistical variability in the CRC estimate will be low.
Acknowledgments
This work was supported in part by NIH grant numbers RO1-CA113941 and RO1-EB009056 as well as EU FP7 SUBLIMA project grant number 241711.
We would like to thank Mr. Matthew Werner of the University of Pennsylvania for help with the image reconstruction algorithm, and Dr. Stefaan Vandenberghe of MEDISIP, Ghent University for useful discussions in planning the various scanner configurations to test with the simulations.
Contributor Information
S. Surti, Email: surti@mail.med.upenn.edu, Department of Radiology at the University of Pennsylvania, Philadelphia, PA 19104 USA (phone: 215-662-7214; fax: 215-573-3880).
Adam R. Shore, Email: arshore89@gmail.com, Formerly with the Department of Radiology at the University of Pennsylvania, Philadelphia, PA 19104 USA
Joel S. Karp, Email: joelkarp@mail.med.upenn.edu, Department of Radiology and Department of Physics and Astronomy at the University of Pennsylvania, Philadelphia, PA 19104 USA.
References
- 1.Budinger TF, Derenzo SE, Gullberg GT, Greenberg WL, Huesman RH. Emission Computer-Assisted Tomography with Single-Photon and Positron-Annihilation Photon Emitters. J Comput Assist Tomogr. 1977;1:131–145. doi: 10.1097/00004728-197701000-00015. [DOI] [PubMed] [Google Scholar]
- 2.Muehllehner G. Effect of Resolution Improvement on Required Count Density in Ect Imaging - a Computer-Simulation. Phys Med Biol. 1985;30:163–173. doi: 10.1088/0031-9155/30/2/005. [DOI] [PubMed] [Google Scholar]
- 3.Surti S, Karp JS, Popescu LA, Daube-Witherspoon ME, Werner M. Investigation of time-of-flight benefit for fully 3-D PET. IEEE Trans Med Imag. 2006;25:529–538. doi: 10.1109/TMI.2006.871419. [DOI] [PubMed] [Google Scholar]
- 4.Adam LE, Karp JS, Brix G. Investigation of scattered radiation in 3D whole-body positron emission tomography using Monte Carlo simulations. Phys Med Biol. 1999;44:2879–2895. doi: 10.1088/0031-9155/44/12/302. [DOI] [PubMed] [Google Scholar]
- 5.Surti S, Karp JS, Muehllehner G. Image quality assessment of LaBr3-based whole-body 3D PET scanners: a Monte Carlo evaluation. Phys Med Biol. 2004;49:4593–4610. doi: 10.1088/0031-9155/49/19/010. [DOI] [PubMed] [Google Scholar]
- 6.Wiener RI, Kaul M, Surti S, Karp JS. Signal analysis for improved timing resolution with scintillation detectors for TOF PET imaging. 2010 IEEE Nuclear Science Symposium Conference Record; Knoxville, TN. 2010. pp. 1991–1995. [Google Scholar]
- 7.Gola A, Piemonte C, Tarolli A. The DLED Algorithm for Timing Measurements on Large Area SiPMs Coupled to Scintillators. IEEE Trans Nucl Sci. 2012;59:358–365. [Google Scholar]
- 8.Dahlbom M, MacDonald LR, Schmand M, Eriksson L, Andreaco M, Williams C. Imaging performance of a YSO/LSO phoswich detector. J Nucl Med. 1998 May;39:52p–52p. [Google Scholar]
- 9.Seidel J, Vaquero JJ, Siegel S, Gandler WR, Green MV. Depth identification accuracy of a three layer phoswich PET detector module. IEEE Trans Nucl Sci. 1999;46:485–490. [Google Scholar]
- 10.Robar JL, Thompson CJ, Murthy K, Clancy R, Bergman AM. Construction and calibration of detectors for high-resolution metabolic breast cancer imaging. Nucl Instr Meth (A) 1997;392:402–406. [Google Scholar]
- 11.Hinse MJ, Thompson CJ. Improving the spatial resolution and image noise in densely pixilated detectors for positron emission mammography. IEEE Trans Nucl Sci. 2005;52:676–683. [Google Scholar]
- 12.Matej S, Lewitt RM. 3D-FRP: Direct fourier reconstruction with Fourier reprojection for fully 3-D PET. IEEE Trans Nucl Sci. 2001;48:1378–1385. [Google Scholar]
- 13.Hudson HM, Larkin RS. Accelerated image reconstruction using ordered subsets of projection data. IEEE Trans Med Imag. 1994;13:601–609. doi: 10.1109/42.363108. [DOI] [PubMed] [Google Scholar]
- 14.Popescu LM. Iterative image reconstruction using geometrically ordered subsets with list-mode data. 2004 IEEE Nuclear Science Symposium and Medical Imaging Conference; Rome, Italy. 2004. pp. 3536–3540. [Google Scholar]
- 15.Wang W, Hu Z, Gualtieri EE, Parma MJ, Walsh ES, Sebok D, Hsieh YL, Tung CH, Song X, Griesmer JJ, Kolthammer JA, Popescu LM, Werner M, Karp JS, Gagnon D. Systematic and Distributed Time-of-Flight List Mode PET Reconstruction. 2006 IEEE Nuclear Science Symposium and Medical Imaging Conference; San Diego, CA. 2006. p. 1722. [Google Scholar]
- 16.Werner ME, Surti S, Karp JS. Implementation and Evaluation of a 3D PET Single Scatter Simulation with TOF Modeling. 2006 IEEE Nuclear Science Symposium and Medical Imaging Conference; San Diego, CA. 2006. pp. 1768–1773. [Google Scholar]
- 17.Watson CC. Extension of Single Scatter Simulation to Scatter Correction of Time-of-Flight PET. IEEE Trans Nucl Sci. 2007;54:1679–1686. [Google Scholar]
- 18.Performance Measurements of Positron Emission Tomographs. Washington, DC: National Electrical Manufacturers Association; NEMA Standards Publication NU 2 2001. [Google Scholar]
- 19.Popescu LM, Lewitt RM. Small nodule detectability evaluation using a generalized scan-statistic model. Phys Med Biol. 2006;51:6225–6244. doi: 10.1088/0031-9155/51/23/020. [DOI] [PubMed] [Google Scholar]
- 20.Alessio AM, Stearns CW, Shan T, Ross SG, Kohlmyer S, Ganin A, Kinahan PE. Application and Evaluation of a Measured Spatially Variant System Model for PET Image Reconstruction. IEEE Trans Med Imag. 2010;29:938–949. doi: 10.1109/TMI.2010.2040188. [DOI] [PMC free article] [PubMed] [Google Scholar]
- 21.Tong S, Alessio AM, Kinahan PE. Noise and signal properties in PSF-based fully 3D PET image reconstruction: an experimental evaluation. Phys Med Biol. 2010;55:1453. doi: 10.1088/0031-9155/55/5/013. [DOI] [PMC free article] [PubMed] [Google Scholar]


