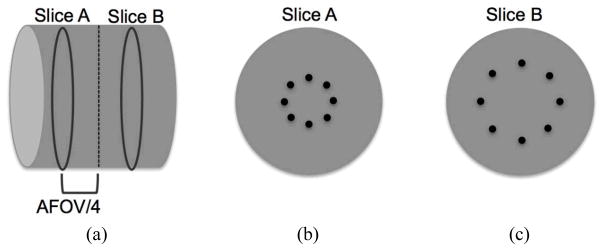
Fig. 1.

Schematic of the simulated lesion phantom. (a) Axial view of the 35 cm diameter × 19 cm long phantoms with hot spheres distributed in Slices A and B at axial positions of AFOV/4 and -AFOV/4. (b) Slice A containing eight spheres at a radial position of 7 cm. (c) Slice B containing eight spheres at a radial position of 14 cm. All spheres are 0.5 cm in diameter and have an activity uptake of 6:1 with respect to the background.
