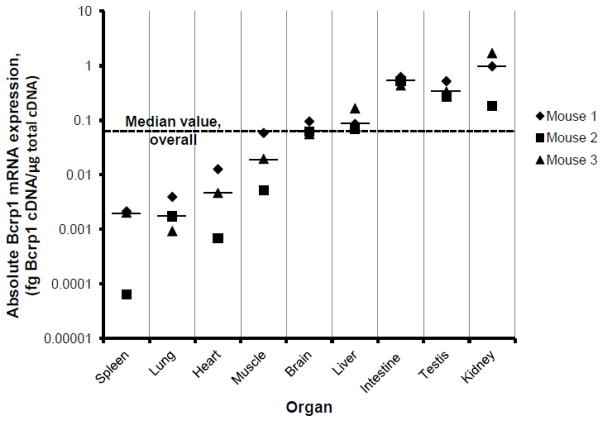
FIGURE 1.
Bcrp1 mRNA expression in a variety of male FVB/NCr mouse tissues, as measured by reverse-transcription qPCR. Data for organs/tissues taken from 3 different mice are displayed. The short horizontal lines represent the median value for each organ/tissue. The median value of Bcrp1 mRNA expression for all determinations is indicated by the horizontal dashed line. Data are expressed as fg of Bcrp1 cDNA per microgram of reverse-transcribed cDNA; points represent the mean of two PCR assays.

