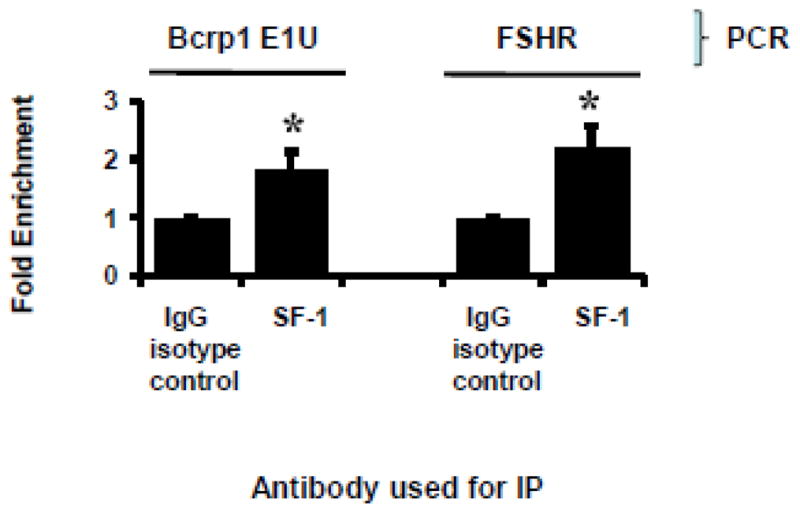
FIGURE 10.

ChIP Assay for E1U and FSHR promoter SF-1 response elements in TM4/SF-1 cells. The results are expressed as fold-enrichment of immunoprecipitated (IP) SF-1-DNA relative to immunoprecipitated (IP) isotype control IgG-DNA after normalization for total DNA input. Shown is the mean and standard deviation of three independent experiments, done on different days. Each individual assay was run in duplicate. The * denotes P< 0.05 compared to IgG isotype control group, using the t-test.
