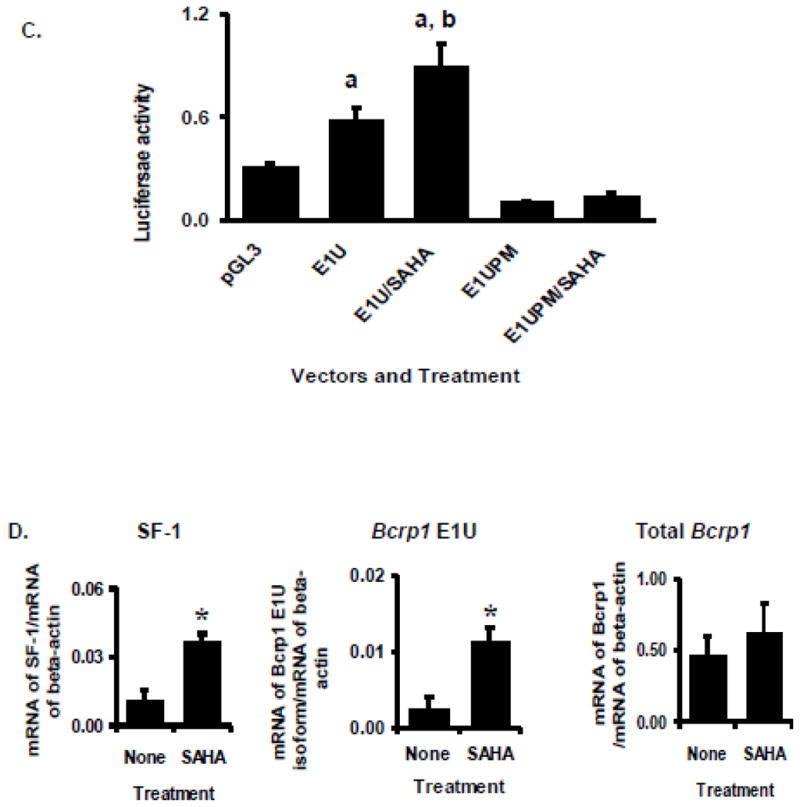
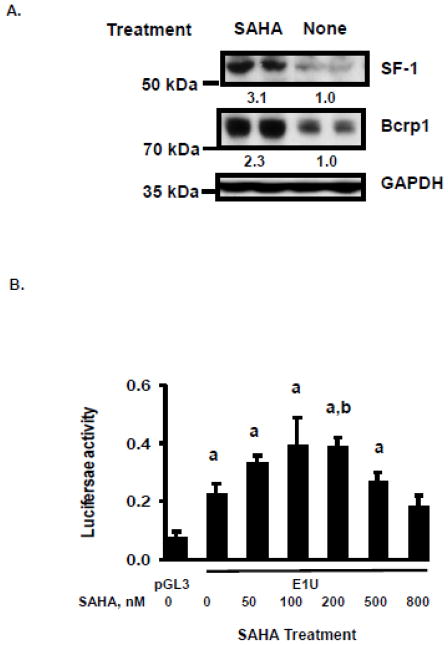
FIGURE 8.

Hyperexpression of SF-1 in TM4 cells by exposure to vorinostat (SAHA). A. Western blot for SF-1, Bcrp1, and GAPDH following culture of TM4 cells with and without 200 nM vorinostat (SAHA) for 48 hours. Results are typical of those obtained in 3 determinations, done on different days. Quantification of band density for SF-1 and Bcrp1 following SAHA treatment relative to control is given as a numerical value below the lanes in Figure 8A. B. Luciferase reporter assays of the Bcrp1 E1U promoter construct in TM4 cells following 24-hour exposure to the indicated concentrations of vorinostat (SAHA). Using the t-test, a statistically significant (P<0.05) difference compared to empty pGL3 vector control is denoted by a; A statistically significant (P<0.05) difference E1U expression in vorinostat treated cells compared to E1U without vorinostat treatment is denoted by b. C. The increase in E1U promoter activity stimulated by vorinostat (200 nM, 24 hours) is abolished by mutation of the SF-1 binding site in the E1U promoter (E1UPM). Using the t-test, a statistically significant (P<0.05) difference compared to empty pGL3 vector control is denoted by a. A statistically significant (P<0.05) difference in E1U expression between vorinostat-treated and -untreated cells is denoted by b. D. Quantitative, real-time RT-PCR assays for SF-1, Bcrp1 E1u mRNA, and Bcrp1 total mRNA relative to expression of β-actin mRNA following exposure to 200 nM vorinostat (SAHA) for 24 h. The * indicates statistically significant greater amounts of mRNA and protein in the vorinostat-treated group compared to untreated group, P<0.05 (t-test). The data shown represent the mean and standard deviation of 3 different experiments, done on different days. Each individual assay was run in duplicate.

