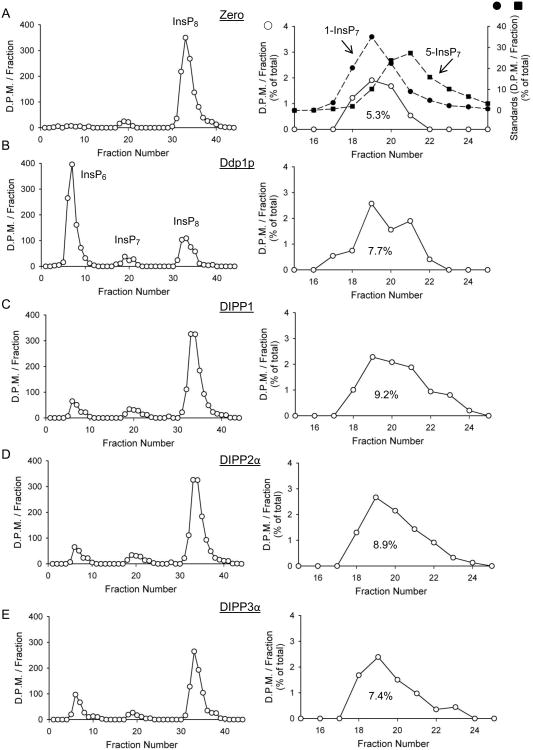
Figure 5. HPLC analyses of InsP8 dephosphorylation by Ddp1p, DIPP1, DIPP2α and DIPP3α.
Representative HPLC runs (protocol 2; Section 2.2) are shown for reactions containing either no enzyme (A; “zero”), or B, 16 ng Ddp1p, C, 2 ng DIPP1, D, 20ng DIPP2α and E, 10ng DIPP3α, all incubated for 8 min with 16 nM InsP8. The right hand panels in each pair amplify the InsP7 region of the chromatograph (open circles; InsP7 is quantified as percentage of total); filled symbols show elution of 1-InsP7 and 5-InsP7 standards (determined individually).

