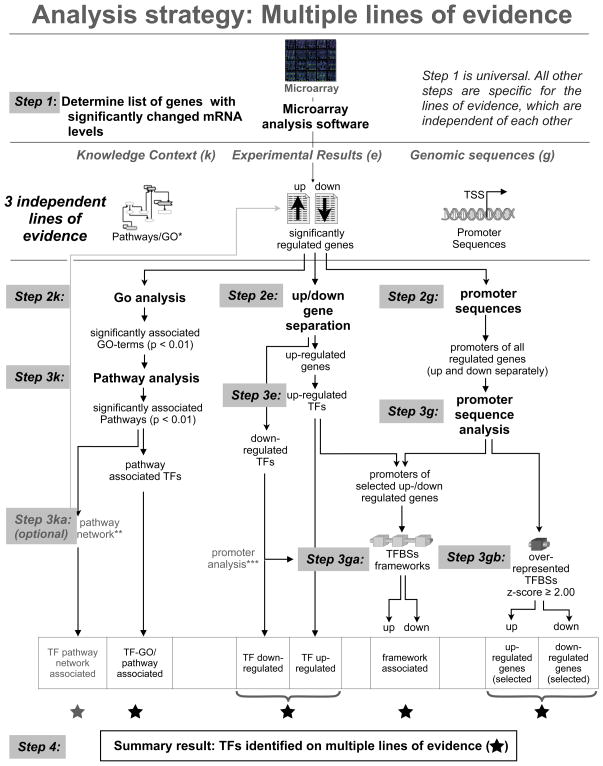
Figure 1. Analysis strategy and summary of results.
The upper part of the figure indicates the three major lines of evidence used in the subsequent analysis. Three parallel threads of analysis were carried out from the associated lines of evidence, each using results from all lines of evidence to focus and restrict the next analysis step. This is indicated by the cross-connections. The whole strategy focused onto transcription factors (TFs) throughout and collected all positive evidence for involvement of a TF. *In case no pathways are available GO categories can be used in the same way. **The pathway network essentially produces a reduced initial list which can be treated exactly the same way as the initial list.***Promoter analysis for the down-regulated genes is carried out exactly as for the up-regulated, if a down-regulated TF is thought to be responsible for the down-regulation.

