Fig. 5.
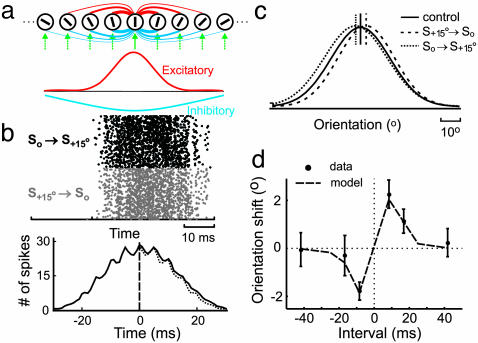
Stimulus-timing-dependent shift in orientation tuning in a model circuit. (a Upper) Model circuit, containing feedforward inputs (green arrows) and excitatory (red) and inhibitory (blue) intracortical connections. Line thickness represents density of connections. Bar within each circle indicates preferred orientation. (Lower) Density distributions of excitatory (red) and inhibitory (blue) intracortical connections. (b) Raster plot of the responses of a model cell to So → S+15° and S+15° → So conditioning (Upper) and crosscorrelogram between them (Lower, spike-timing asymmetry was 3.3%). (c) Orientation tuning of a model neuron during control (solid line), after S+15° → So conditioning (dashed line) and after So → S+15° (dotted line) conditioning (interval: 8.3 ms). Vertical lines indicate peak positions of tuning curves. (d) Conditioning-induced shift in tuning as a function of conditioning interval. Dashed line, results of simulation; dot with error bar, shift (means ± SE) measured experimentally (35).

