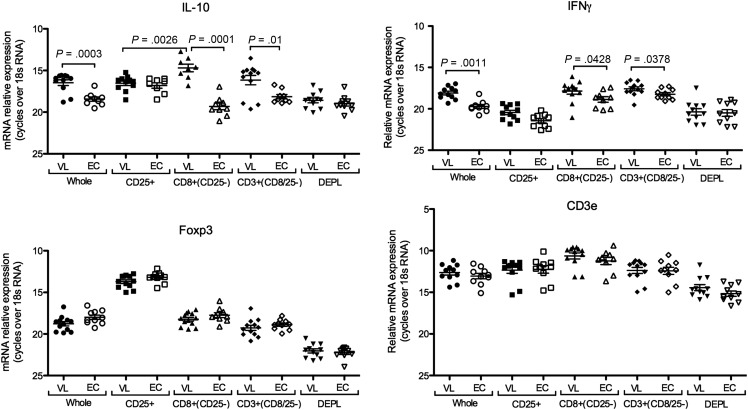
Figure 2.
VL CD8 cells express high levels of both IL-10 and IFNγ mRNA. mRNA expression in VL and EC PBMC subsets isolated sequentially by MACS beads as indicated. Significant differences are indicated by P-values for IL-10 and IFNγ. Foxp3 expression was significantly higher in CD25+ cells compared to all other subsets (P = .001). CD3 ε expression was significantly higher in all positively selected cell subsets (CD25, CD8 and CD3) compared to whole PBMC and depleted cells (P < .05). Each symbol represents one donor. Comparison between VL and EC were done using t-test and between cell populations originating from the same donors using a paired t-test. Non-parametric tests (Mann–Whitney U test or Wilcoxon matched pair test) were used when normality test failed.

