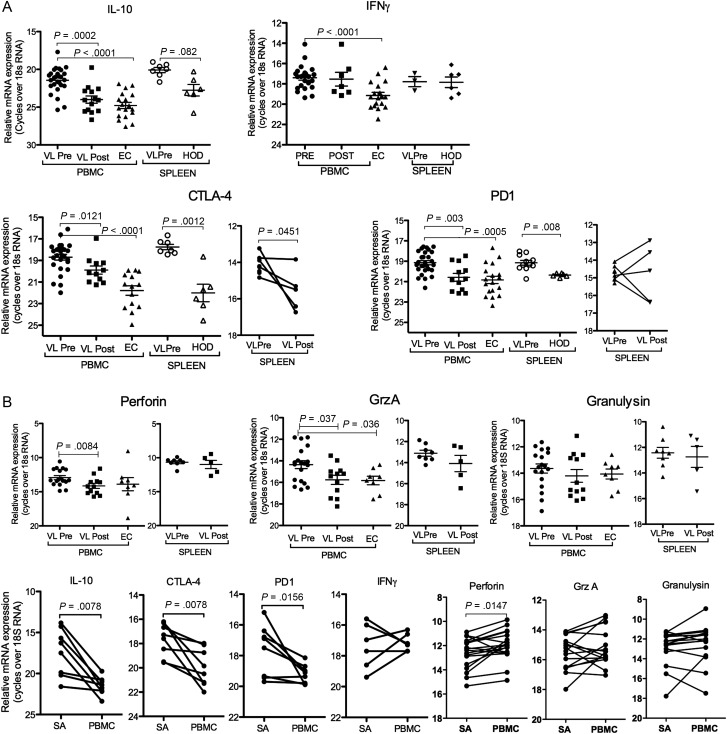
Figure 3.
Gene expression in SA and PBMC CD8 cells is suggestive of anergic/exhausted cells. A, Relative gene expression, as indicated in figure, in MACS purified CD8 cells from PBMC and spleen of patient and controls. B, Comparison of relative gene expression in paired pre-treatment SA and PBMC CD8 cells. Samples analyzed for different transcripts are not necessarily from the same donors, thus only samples within the same graph can be compared. Significance differences between groups where n ≥ 6, are indicated with P-values. Each symbol represents one sample. Paired samples are indicated with a solid line. All groups were compared using Mann–Whitney U test. The pre-post treatment groups contain both paired and unpaired samples. P-values in graphs show test for unpaired samples. Wilcoxon match paired test was used for comparison of paired PBMC and SA CD8 cells.

