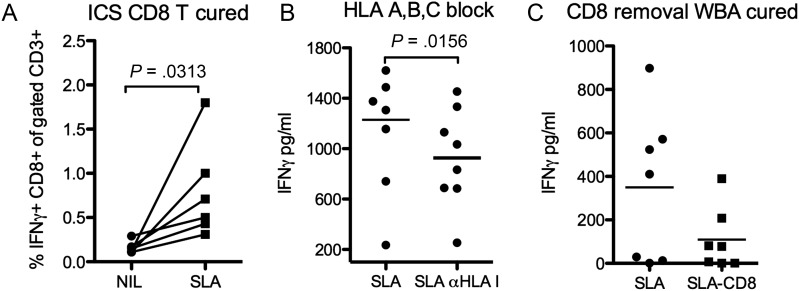
Figure 6.
CD8 cells contribute to antigen specific IFNγ production following clinical cure (6 months post-treatment). A, Frequency of IFNγ CD8T cells out of total (CD3+) T cell population following 24 hours stimulation with or without SLA as determined by intra cellular staining and FACS analysis. BFA was added to the cultures for the last 8 hours. B, Effect of pan-HLA-I blockade on IFNγ detection in supernatants from SLA stimulated whole blood following 24 hours of culture, comparison was done with isotype control stimulated samples (C) Effect of CD8 depletion on IFNγ detection in supernatants from SLA stimulated WBA. Net values (IFNγ in stimulated minus IFNγ in unstimulated samples) are shown in figure B & C. Statistical significances using student's paired t-test are indicated by P-values in figures.

