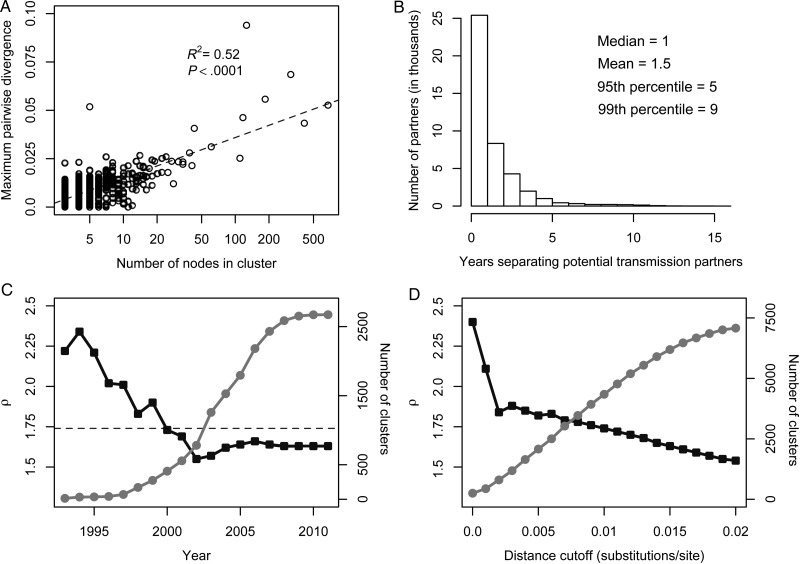
Figure 5.
Properties of the human immunodeficiency virus type 1 global transmission network. A, Relationship between cluster size and maximum pairwise divergence within a cluster. B, Number of years separating viral sequence isolation from potential transmission partners in the global transmission network. C, Network characteristic exponent ρ (black squares) stabilizes as number of clusters (gray circles) increases. Dashed line shows ρ inferred from the complete network. D, Effect of distance cutoff for potential transmission partners on network characteristic exponent ρ (black squares) and the number of clusters (gray circles).

