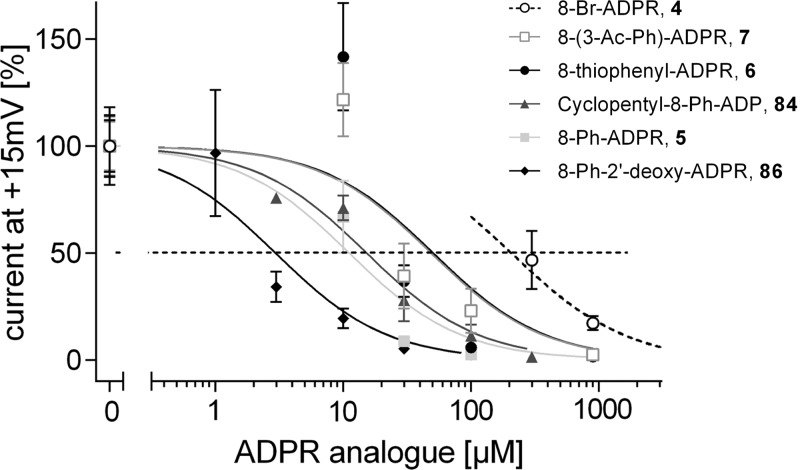
Figure 10.
Concentration–response relationship of ADPR antagonists. Because these data were recorded over a significant time frame, a certain variation of the mean currents obtained when using a pipet solution with 100 μM ADPR (1) occurred. In detail, the mean value ± SEM [in nA] of 100 μM ADPR (1) infusion was: for 5, 1.17 ± 0.13 (n = 16); 7, 1.25 ± 0.14 (n = 22); 6, 1.70 ± 0.25 (n = 20); 86, 1.23 ± 0.22 (n = 15); 4, 1.13 ± 0.14 (n = 16); and 84, 1.44 ± 0.20 (n = 8). To construct concentration–response curves and determine IC50 values, data were therefore normalized to the mean response of the control (100 μM of 1) for the corresponding set of experiments. Outward current as percentage of control is indicated as mean ± SEM. For estimation of IC50 values the level of 50% of control is marked by a dashed line. Except for 4, data were fitted to a three parameter logistic function constraining the top and bottom values to 100% and 0%, respectively. For 4, the course of the concentration–response curve was estimated by shifting a logistic function to the right.

