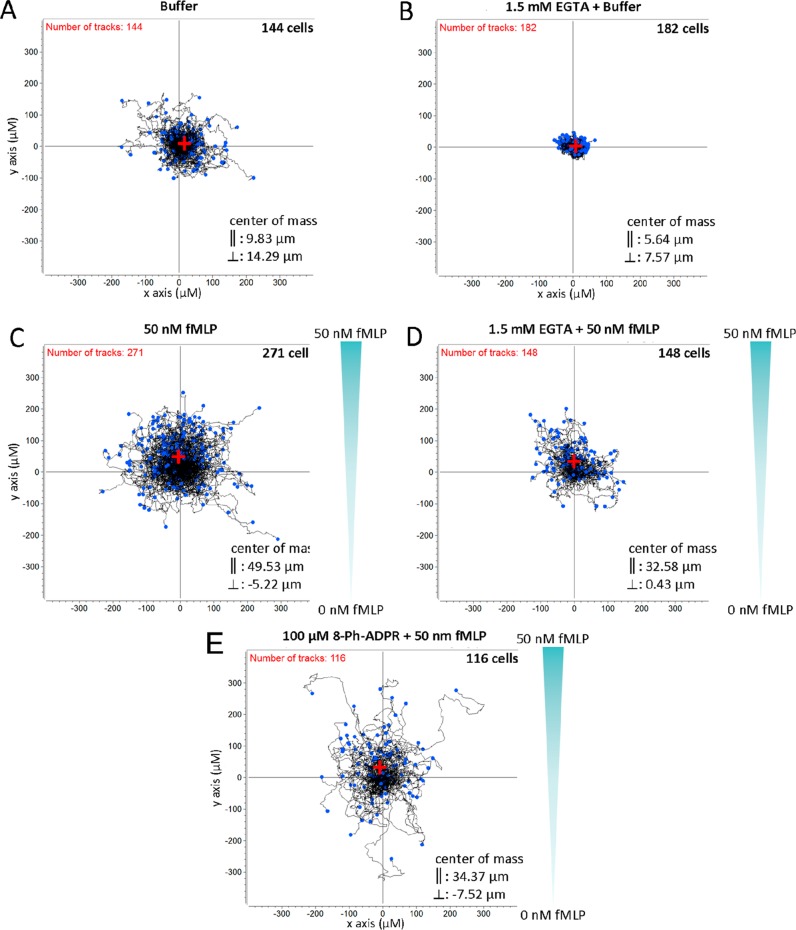
Figure 12.
Partial antagonism of chemotaxis in human neutrophils upon preincubation with 8-Ph-ADPR (5). Migration of freshly isolated primary human PMN was analyzed as detailed in the Experimental Section. (A) buffer, (B) buffer and 1.5 mM EGTA, (C) 50 nM fMLP gradient (indicated in green), (D) 50 nM fMLP gradient and 1.5 mM EGTA, (E) 50 nM fMLP gradient and 5. All cells were standardized to the center of the coordinate system as a start point. Black lines indicate trajectories of single cells during measurement. Blue dots represent the position of each cell at the end of measurement. The center of mass as mean of the position at the end of the measurement of all cells is marked by a red cross with ∥ showing mean movement in the y direction along fMLP gradient and ⊥ showing mean movement in the x-direction. Cells shifted in presence of fMLP (C) 49.4 μm, fMLP/EGTA (D) 32.6 μm, and fMLP/5 (E) 34.4 μm in the ∥ direction. In the absence of fMLP, cells showed less migration in the ∥ direction (buffer control (A), 9.8 μm, buffer/EGTA; (B), 5.6 μm).

