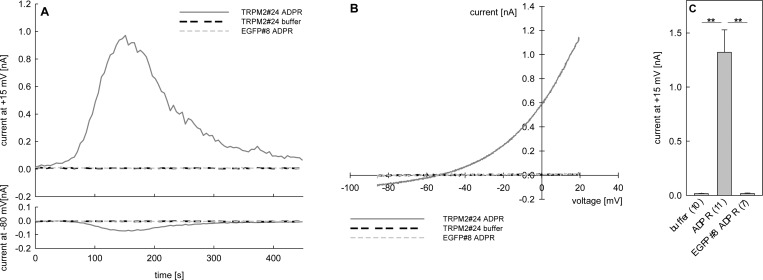
Figure 4.
Stimulation of clone TRPM2#24 by infusion of 100 μM ADPR. Membrane currents of TRPM2#24 and EGFP#8 were measured in the whole-cell configuration using repetitive voltage ramps from −85 to +20 mV. Experiments were carried out with 1 mM Ca2+ and 140 mM NMDG instead of sodium in the extracellular solution. The free [Ca2+]i in the pipet solution was buffered to 200 nM by EGTA. (A) Characteristic tracings of membrane current at +15 mV and at −80 mV over time from representative experiments of TRPM2#24 (gray and black broken line) and EGFP#8 (gray broken line) stimulated with 100 μM ADPR (1) or vehicle (buffer) are shown. (B) Current–voltage relationship of the representative experiments shown in (A) at ramp 30 (corresponding to maximum ADPR induced current of TRPM2#24). (C) Maximum potassium outward current at +15 mV induced by infusion of buffer or 100 μM ADPR in TRPM2#24 or EGFP#8 indicated as mean ± SEM (n = 7–11), **, P < 0.01 (t test).

