Fig. 3.
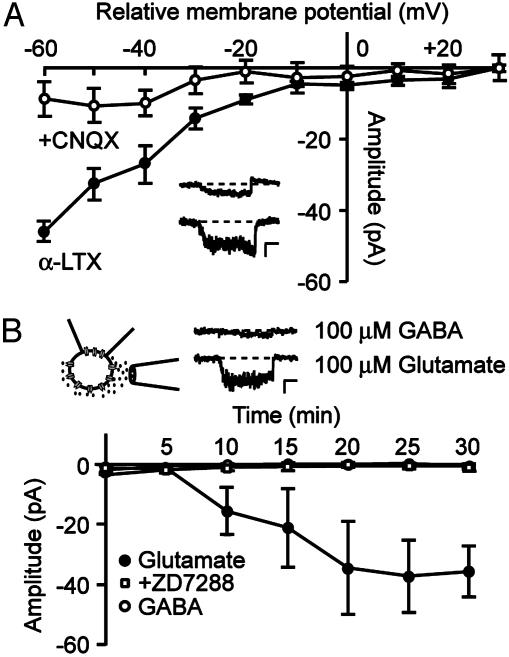
Enhanced glutamatergic activity increases Ih. (A) I-V curve of cell-attached Ih recorded in the presence of 0.15 nM α-LTX (filled symbols) and after subsequent bath application of the AMPA receptor antagonist CNQX (50 μM, open symbols). (Inset) Current traces, recorded by stepping to a relative membrane potential of -60 mV in the presence of α-LTX (lower) and after addition of CNQX (upper). (Scale bars, 20 pA and 250 ms.) (B) Glutamate or GABA was applied near the soma by short and repeated pressure application. Pressure application of 100 μM glutamate (filled circles) gradually increased the amplitude of Ih, whereas application of 100 μM GABA (open circles) had no detectable effect. Including 50 μM ZD7288 (open squares) in the pipette solution prevented the increase in Ih. The cartoon is a schematic representation of the recording configuration. Example current traces are shown that were recorded by stepping to a relative membrane potential of -60 mV after glutamate (lower) and GABA (upper) application. (Scale bars, 10 pA and 250 ms.) Data points represent mean ± SEM of four to seven cells.

