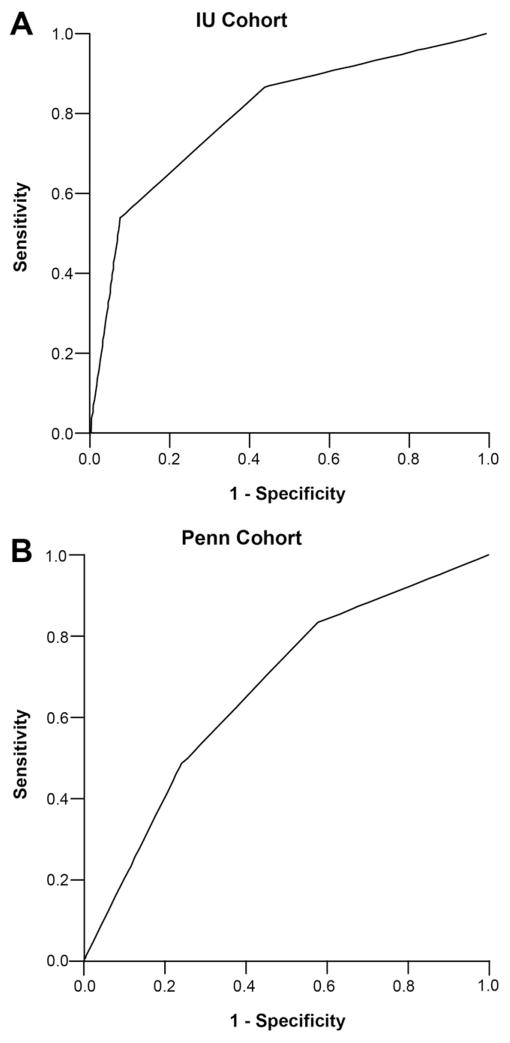
Figure 1.
The area under the receiver operator curve for the model in prediction of 7-day mortality in the (A) IU–ICU and (B) Penn–ICU cohorts, with the respective c-index and sensitivity and specificity according to low-risk (0–1 points), medium-risk (2 points), and high-risk (3–4 points) scores. (A) The c-index was 0.80 (95% CI, 0.72–0.87). The sensitivity and specificity for the low score were 100% and 0%, for a medium score were 87% and 56%, and for a high score were 51% and 91%, respectively. (B) The c-index was 0.67 (95% CI, 0.59–0.74). The sensitivity and specificity for a low score were 100% and 0%, for a medium score were 83% and 42%, and for a high score were 48% and 76%, respectively.

