
Figure 1. Zipper-like closure within the mouse hindbrain.
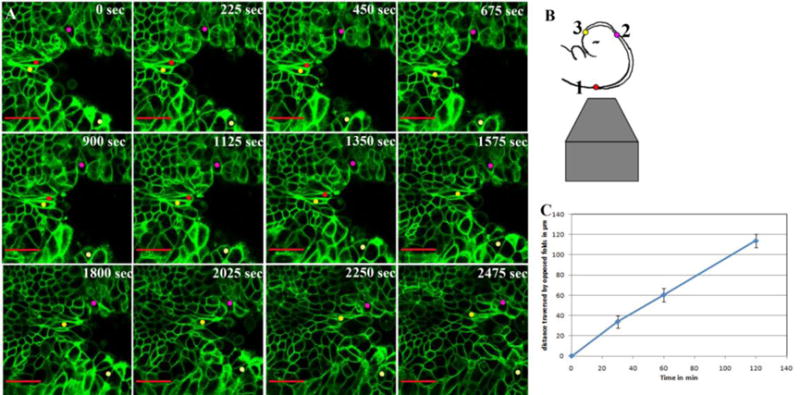
A. Still images from movie 1 captured from time lapse imaging of the hindbrain with the time points in seconds indicated in each panel. The folds come together in a zipper-like manner in a region of the hindbrain rostral to closure point 1. Colored dots track individual cells throughout the time period of imaging. Scale bar 20μm.
B. The schematic on the right represents embryo orientation relative to the objective lens and the red dot represents closure point 1.
C. Closure in the hindbrain proceeds at a rate of ∼1um/min when the folds are at least 120 um apart through closure. Error bars denote the standard deviation for the distance crossed for each time point in three different embryos.