
Figure 2. Secondary closure points in the midbrain.
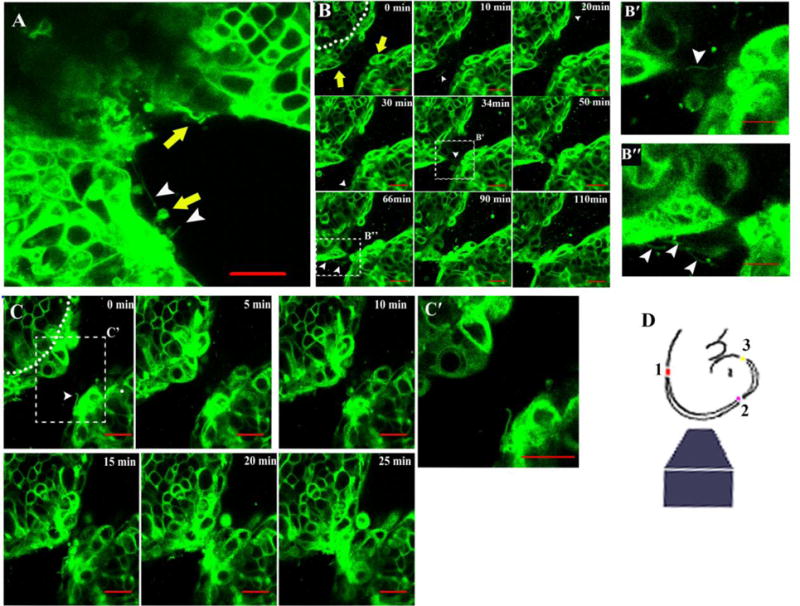
(A) Transition between zippering in the hindbrain to buttoning in the midbrain. White arrowheads indicate thin cell extensions, yellow arrows indicate protruding cells (three neighboring cells protrude from the fold on lower left as observed over time and in a different z plane; not shown). Scale bar 20μm.
(B, C) and movies 2 and 3. Imaging of the ∼E9.25 midbrain region schematically shown between closure points 1 and 2 (D, red and purple dots, respectively). Time points in minutes are indicated in each panel. Note a single or a few cells protrude from the non-neural ectoderm layer (demarcated from neural ectoderm by dotted line) on both sides of the neural folds (yellow arrows) and interact with protruding cells on the opposing neural fold. Boxes highlight magnified views showing thin cell extensions in the gap between neural folds (white arrowheads) and which appear to connect the opposing folds (panels B′ and B′) at the position that the secondary closure will form. Scale bar in all panels is 20 μm.