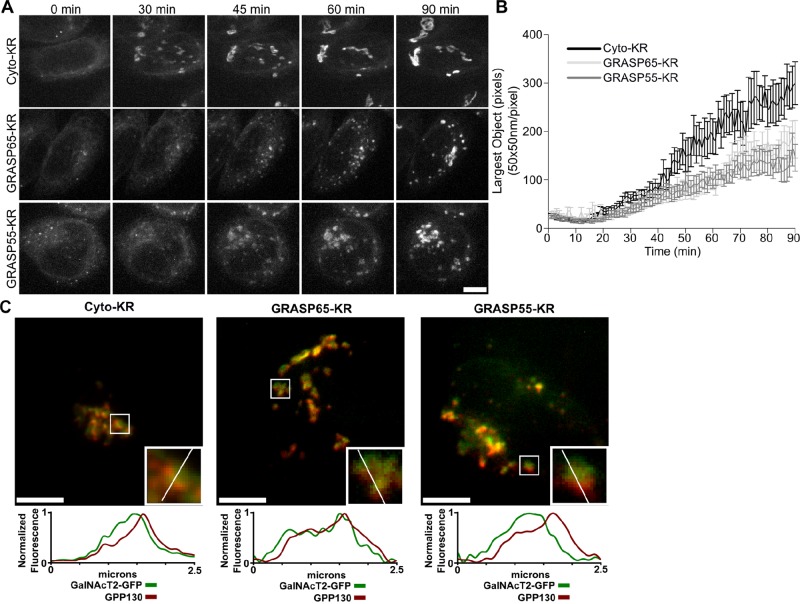
FIGURE 1:
Inactivation of GRASP proteins blocks Golgi ribbon formation. (A) Cells stably expressing GalNAcT2-GFP were transfected with KR constructs. After 2 d, GalNAcT2-GFP was redistributed to the ER with 20 μg/ml brefeldin A for 20 min. Cells were then quickly washed and placed in imaging medium and irradiated with 535- to 580-nm light at an intensity of 2 W/cm2 for 30 s. Average value z-projections of GalNAcT2-GFP fluorescence are shown for the indicated times after inactivation. Scale bar, 5 μm. (B) Golgi assembly was quantified by determining the size of the largest GalNAcT2-GFP object at each time point, with the threshold set above the level of GalNAcT2-GFP fluorescence in the ER (n = 10, mean ± SEM). (C) Cells were fixed 90 min after BFA washout and stained for GPP130. Fluorescence intensity across the width of the Golgi objects (white line, inset) was measured and compared for the Golgi markers GPP130 (red) and GalNAcT2-GFP (green). Scale bar, 5 μm.

