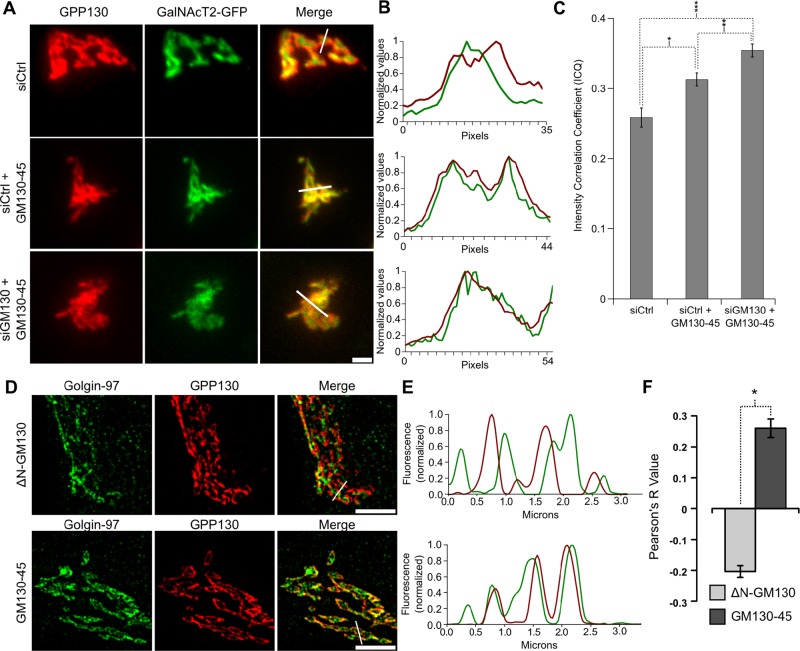
FIGURE 5:
Expression of the GM130-45 chimera increases marker colocalization. (A) Average value z-projections of immunofluorescence images of endogenous GPP130 and stably expressed GalNAcT2-GFP in control knockdown cells, control knockdown cells expressing GM130-45, and GM130 knockdown cells rescued with GM130-45. Scale bar, 5 μm. (B) Profile plots of normalized pixel intensity of GPP130 (red) and GalNAcT2-GFP (green) corresponding to the region marked with white lines in A. (C) Colocalization of endogenous GPP130 and GalNAcT2-GFP across experimental conditions as measured by ICQ (n ≥ 15 cells, mean ± SEM; *p = 0.002, **p = 0.016, ***p = 8.2 × 10⁻⁷). (D) HeLa cells were transfected with ∆NGM130 or GM130-45. Shown is a representative single z-slice of a three-dimensional structured illumination image showing fluorescence patterns of endogenous GPP130 (red) and golgin-97 (green). Scale bar, 5 μm. (E) Normalized values of pixel intensity for GPP130 (red) and golgin-97 (green) along the region indicated by the white lines in D. (F) Colocalization of endogenous GPP130 and golgin-97 is described by the Pearson's correlation coefficient for cells transfected with ∆N GM130-WT or GM130-45 (n ≥ 15, mean ± SEM; *p = 2.9 × 10⁻¹¹).

