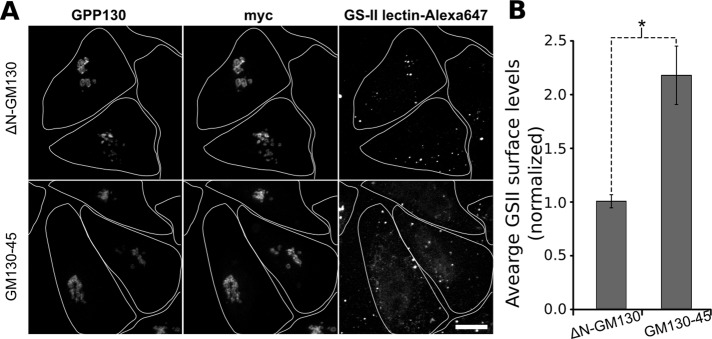
FIGURE 6:

Decreased glycan processing in cells expressing the GM130-45 chimera. (A) Cell surface staining for terminal N-acetyl-d-glucosamine levels was performed using Alexa 647–conjugated GSII-lectin. Cells were transfected with the GM130-45 construct were grown for 84 h and then treated with trypsin and passed onto new coverslips for 12 h before fixation. The Golgi marked by GPP130 and myc-tagged ∆N-GM130 or GM130-45 construct levels are also shown. Maximum value z-projections are shown for each channel. Cell boundaries are outlined to the extent that they were evident from a low level of background staining detected upon overexposure in the anti-myc channel. A small degree of fluorescent signal was present beyond these boundaries and most likely represents lectin binding to cells whose boundaries escaped detection or lectin binding to cell debris. Scale bar, 10 μm. (B) Average staining of GSII-lectin normalized to the mean value of control cells (n > 15 cells, mean ± SEM). Only fluorescence within identified cell boundaries was quantitated. Statistical significance was determined using a single-tailed paired Student's t test (*p = 0.00001).
