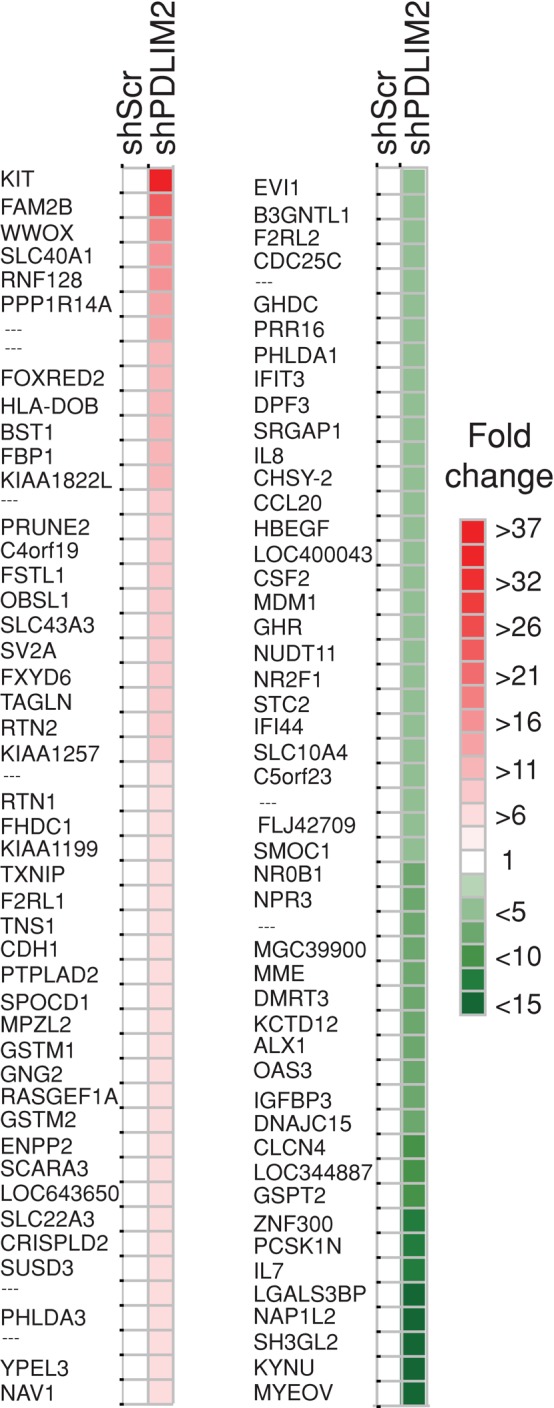
FIGURE 5:

Suppression of PDLIM2 alters global gene expression in DU145 cells. A basic heat map demonstrating the top 100 differentially expressed genes (50 most up-regulated and 50 most down-regulated), based on fold changes generated using JColorGrid software. See also Supplemental Table S1.
