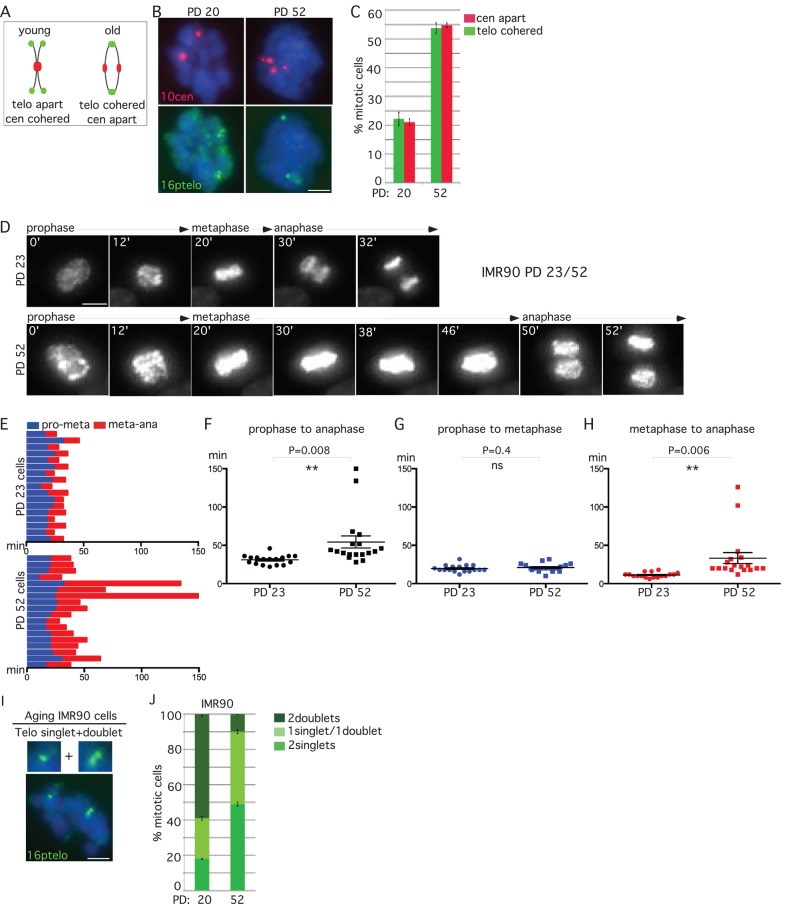
FIGURE 4:
Replicative aging leads to anaphase delay. (A–C) Centromeres separate concomitant with persistent telomere cohesion in aging IMR90 cells. (A) Schematic diagram depicting persistent telomere cohesion and loss of centromere cohesion young vs. old cells. (B, C). IMR90 cells from PD 20 and 52 analyzed by (B) centromere (red) and telomere (green) FISH after mitotic shake-off. DNA was stained with DAPI (blue). Scale bar, 5 μm. (C) Graphical representation of the frequency of mitotic cells with centromeres apart and telomeres cohered. Values are means ± SEM, derived from two independent experiments (n = 45–50 cells each). (D–H) Time-lapse video live-cell imaging of IMR90-H2B-GFP cell line at PD 23 and 52. (D) Progression from prophase to anaphase for individual cells. Scale bar, 5 μm. (E–H) Graphical summaries of individual mitotic cells (n = 17–18 cells) shown as (E) a time line and (F–H) scatter plots with calculated mean value ± SEM. Student's t test was used to calculate p values (ns, p ≥ 0.05; **p ≤ 0.01). (I, J) Aging cells show loss of synchrony in sister telomere separation. (I) Aging IMR90 cells analyzed by telomere (green) FISH after mitotic shake-off exhibit one singlet/one doublet. DNA was stained with DAPI (blue). Scale bars, 5 μm. (J) Graphical representation of the frequency of mitotic cells with one singlet/one doublet, two singlets, or two doublets in IMR90 cells at PD 20 or 52. Values are means ± SEM, derived from two independent experiments (n = 50 cells each).

