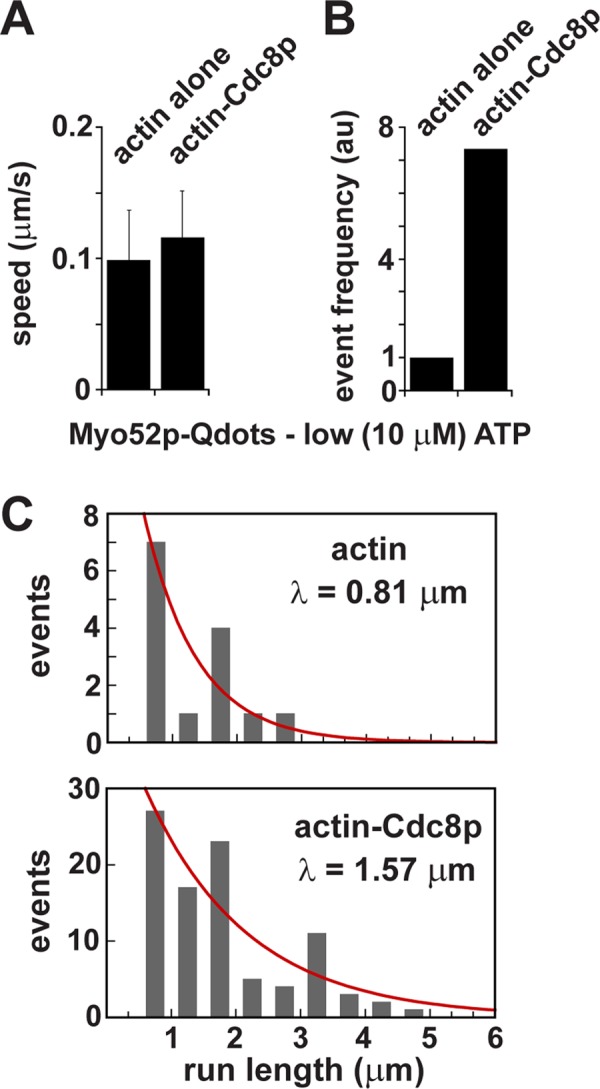
FIGURE 3:

Movements of single Myo52p molecules along actin and actin-tropomyosin tracks at low ATP concentration. Processive movement of Myo52p-HMM molecules coupled to Qdots (1:10 M ratio) along rhodamine-phalloidin–labeled actin filaments at low ATP concentration (10 μM) using TIRF microscopy. Representative events are presented in Supplemental Movie S3. (A) Speeds of Myo52p-Qdots on actin vs. actin-Cdc8p tracks (n = 17, actin alone; n = 104, actin-Cdc8p). (B) Relative frequency of Myo52p runs along actin vs. actin-Cdc8p tracks (17 runs/1123.8 μm available actin vs. 104 runs/959.6 μm available actin-Cdc8p). The frequency of Myo52p movements on actin alone was normalized to 1.0. (C) Histogram of run lengths for Myo52p molecules along actin vs. Cdc8p-decorated actin tracks. The red curves show the exponential fits (y = Ae−x/λ) used to determine the run length, λ.
