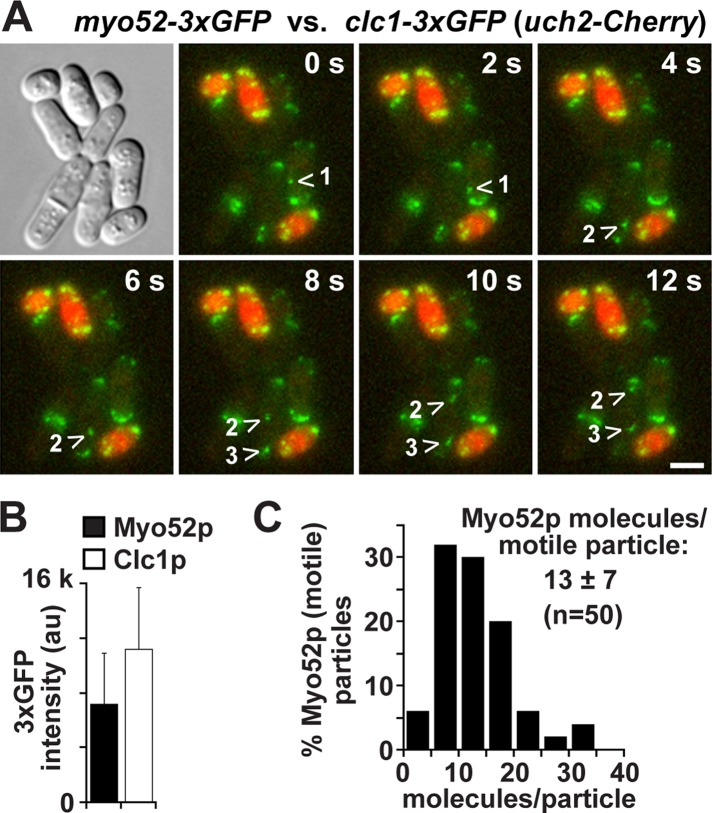
FIGURE 4:
Estimating the numbers of Myo52p molecules per motile particle in the cell. The signal intensity of GFP in motile Myo52p-3xGFP particles was used to estimate the number of Myo52p molecules/particle. Clathrin light-chain (Clc1p-3xGFP) signal was used as a standard based on its previously characterized distribution at actin patches (40 molecules/patch; Sirotkin et al., 2010). (A) Representative time-lapse images of a mixed population of myo52-3xGFP and clc1-3xGFP cells (after growth on YE5S rich medium at 25°C). clc1-3xGFP cells were distinguished from myo52-3xGFP cells by inclusion of a genomic uch2-Cherry fusion, which marks nuclei red. The GFP (green) images shown are maximum projections generated from seven z-stacks. The arrowheads track the movement of three different motile Myo52p particles. Bar, 4 µm. (B) Histogram comparing the average GFP intensities for motile Myo52p particles and Clc1p patches. (C) Histogram of the distribution of Myo52p GFP intensities expressed as number of dimeric motors/motile particle.

