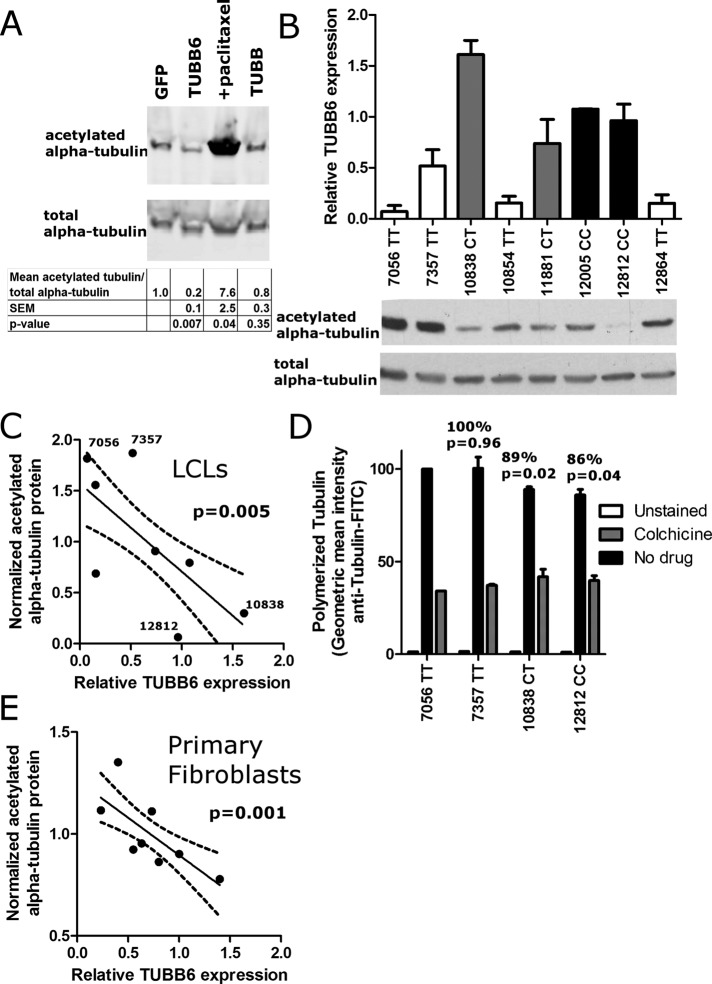
FIGURE 3:
Variation in TUBB6 expression alters microtubule stability. (A) Overexpression of TUBB6 in HEK-293 cells reduces microtubule stability based on amount of acetylated α-tubulin. Cells were transfected to overexpress the indicated protein or treated with 50 nM paclitaxel. After 40 h, cell extracts were harvested and immunoblotted for acetylated α-tubulin and total α-tubulin. TUBB6 overexpression decreased acetylated tubulin. Blots are representative of three different experiments. Values below the blots show the relative amount of acetylated tubulin, normalizing for the amount of total α-tubulin and setting the GFP transfected cells to a value of 1. Mean, SEM, and p value are calculated from quantification of blots from three different experiments. (B) TUBB6 expression and acetylated tubulin in LCLs. TUBB6 mRNA was measured by Taqman real-time PCR assay using 18S expression as the control. Data are the mean and SEM from three experiments. Bar graphs are color coded by genotype: TT, white; CT, gray; and CC, black. From the same LCLs, the amounts of acetylated α-tubulin and total α-tubulin are shown below the bar graph. Blots are representative of three experiments. (C) TUBB6 expression and acetylated tubulin are inversely related in LCLs. Mean relative TUBB6 expression was plotted vs. the mean amount of acetylated α-tubulin normalized for total α-tubulin. The points are the mean TUBB6 expression and mean acetylated tubulin values from three separate experiments for eight LCLs. The plot displays an inverse relationship, with p = 0.005 for significantly nonzero slope. Dashed lines show 95% confidence intervals. Higher levels of TUBB6 are correlated with lower levels of acetylated tubulin. (D) The amount of polymerized tubulin is reduced in LCLs that have less acetylated tubulin and higher TUBB6 expression. The two LCLs with the lowest and highest levels of acetylated tubulin in C were stained for anti–tubulin-FITC using a method that stains preferentially for polymerized tubulin by permeabilizing at the same time as fixation (Morrison and Hergenrother, 2012). Geometric mean intensity for the four LCLs is normalized to 100 for LCL 7056. LCL 7357 gave similar staining intensity, whereas the two LCLs with the lowest level of acetylated tubulin (10838 and 12812) had lower staining intensity. Mean, SEM, and p values (paired t tests) are from three independent experiments. As a control for severely reduced polymerized tubulin, the intensity of colchicine treated LCLs is also shown (gray) and found to be ∼40% of the untreated level for 7357. (E) TUBB6 expression and acetylated tubulin are inversely related in primary fibroblasts. Mean relative TUBB6 expression was plotted vs. the mean amount of acetylated α-tubulin normalized for total α-tubulin. The points are the mean TUBB6 expression and mean acetylated tubulin values from three separate experiments for fibroblasts from eight individuals. The plot displays an inverse relationship, with p = 0.001 for significantly nonzero slope. Dashed lines show 95% confidence intervals. Higher levels of TUBB6 are correlated with lower levels of acetylated tubulin.

