FIGURE 5:
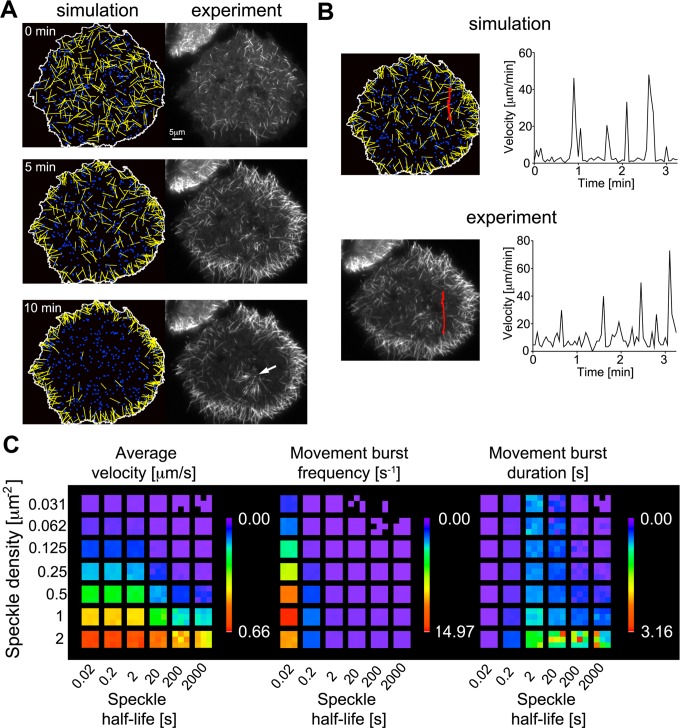
Stochastic simulations of short-microtubule movements. Microtubules (yellow), dynein speckles (blue), and their interactions were modeled based on experimental observations and known physical properties of system components (for details, see Materials and Methods and experimental parameters in Table 2). (A) Stochastic simulations closely mimic the experimentally observed distribution of microtubules over time as they accumulate at the cell periphery (see also Supplemental Movie S11). The initial time point (0 min) is defined as the first observation of nucleated microtubules after nocodazole washout. Immobile microtubules anchored to the microtubule-organizing center observed in the experiment (white arrow) are not included in the simulation. (B) Tracking of individual short microtubules shows that dynamic microtubule behavior, with intermittent bursts and pauses of rapid motility, is observed in both simulations and experiments. (C) Systematic variation of speckle density and speckle half-life in simulations lacking a cell border. Three heat maps visualize the average short-microtubule velocity, as well as the frequency and duration of movement bursts. Each colored subsquare corresponds to one simulation with random initial conditions.

