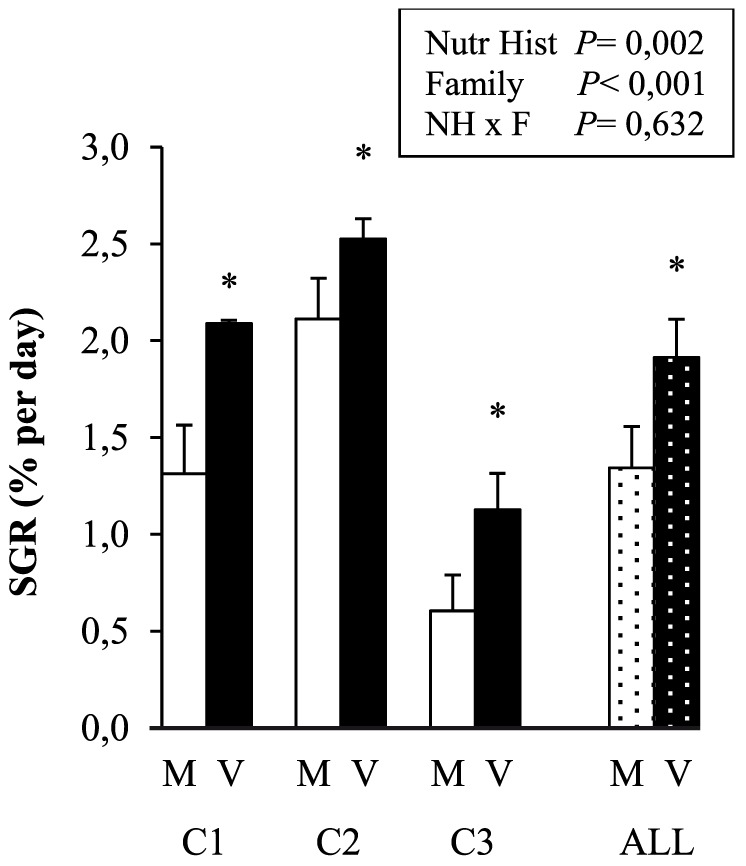
Figure 2. Specific growth rate (SGR) of the trout during the 25-day V-challenge according to the early nutritional history (M or V) and family (C1, C2, C3).

Values are means ± SEM (n = 4, except for C3M and C1V with n = 3). Dotted bars represent the effect of nutritional history (M or V) during the V-challenge, averaged over all three families (ALL, means ± SEM, n = 11). The significance of the effects of nutritional history, family (C2>C1>C3) and their interaction (2-way ANOVA) is added in the figure, * indicates a significant effect of nutritional history (V>M, p<0.05).
