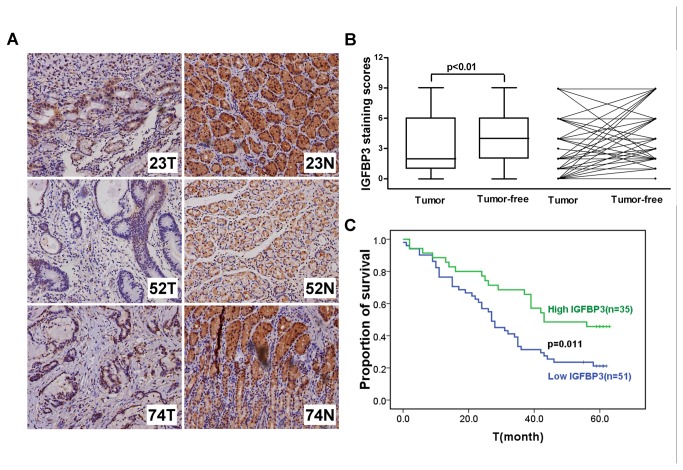
Figure 4. The expression of IGFBP3 is downregulated in gastric tumor tissues and related to the survival of patients.
(A) The expression levels of IGFBP3 were detected by immunochemistry analysis in 86 pairs of gastric tumor and matched adjacent normal tissues. Representative photos were shown in 3 paired tumor (T) and normal (N) tissues. (B) The comparison of staining scores of IGFBP3 between gastric tumor and adjacent tumor free tissues. (C) Survival curves were plotted based on the Kaplan-Meier survival analysis. The expression level of IGFBP3 was used as the variate to separate two lines.

