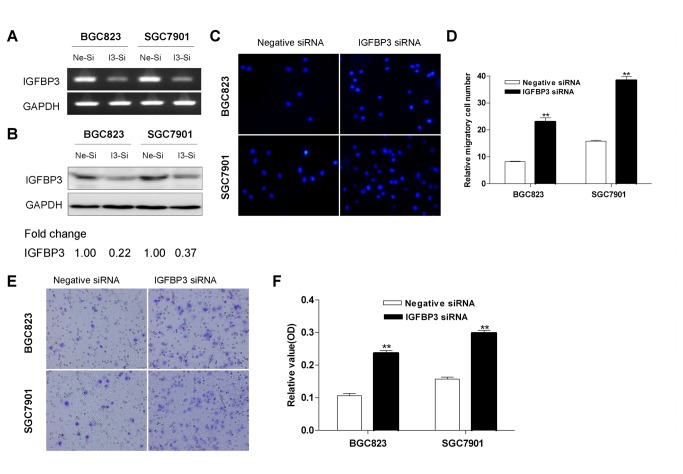
Figure 5. IGFBP3 inhibits the migration and invasion of gastric cancer cells.
The expression of IGFBP3 in BGC823 and SGC7901 cells were detected by conventional RT-PCR (A) and Western blotting (B) after transfected with negative control siRNA (Ne-si) or IGFBP3 siRNA (I3-si). Densitometry values are expressed as fold change compared with negative control siRNA values normalized to 1. (C) Cell migration was assessed by modified Boyden transwell chambers assays. After incubation for 16h, cells that migrated to the bottom of the membrane were stained with DAPI. (D) The mean number of visible migratory cells was counted in five random high power fields. These experiments were performed in triplicate. ** indicates of p<0.01. (E) BD Matrigel coated chambers were used to assess cell invasion. Invaded cells on the bottom of the membrane were stained with cell stain solution. (F) Invaded cells were washed by Extraction Buffer and detected on a microplate reader (560 nm). ** indicates of p<0.01.

