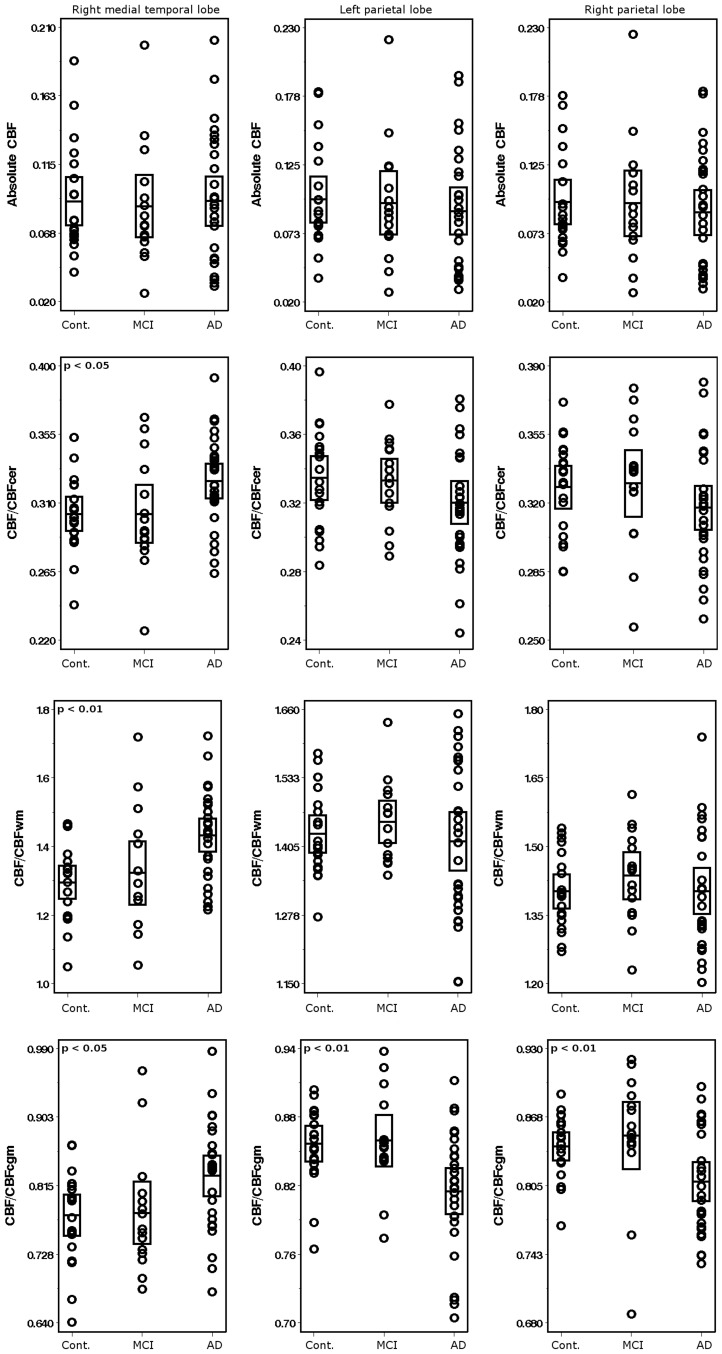
Figure 2. Scatter plots of CBF values for controls, patients with mild cognitive impairment, and patients with Alzheimer’s disease in both parietal lobes and right medial temporal lobe.
Absolute CBF units are given in ml of blood/100 g of tissue/min. Cont, controls; MCI, mild cognitive impairment; AD, Alzheimer’s disease. Bar shows two standard deviations below and above the mean (horizontal line). p, one-way ANOVA p value.

