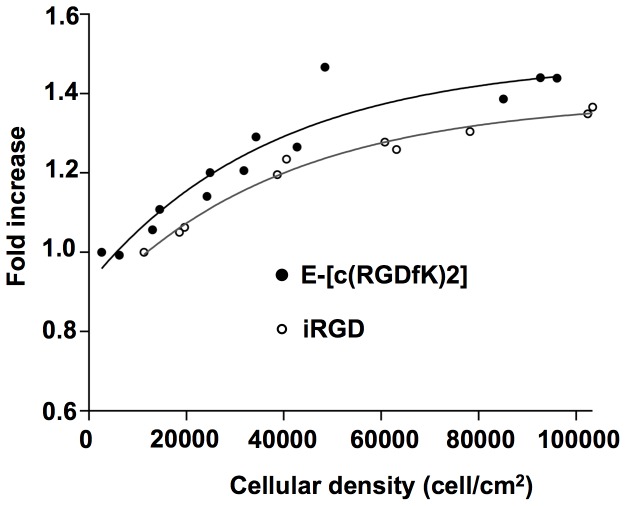
Figure 2. Cell density dependence of the U87 cell labeling by E-[c(RGDfK)2] or iRGD.
The «fold increase» represents the normalized value of the median fluorescence intensity (MFI) observed for a given cell density compared to the lowest one (0.8*104 and 104 cell/cm2 for the E-[c(RGDfK)2] and the iRGD conditions, respectively). Experimental results were fitted following exponential curves of the type y = a + b × exp−cx with a, b and c equal to 1.4853±0.064; −0.55979±0.0587; 2.5987×10−05±7.89×10−06 and 1.3862±0.0257; −0.52569±0.0249; 2.5936×10−05±4.42×10−06 for the E-[c(RGDfK)2] and iRGD respectively.

