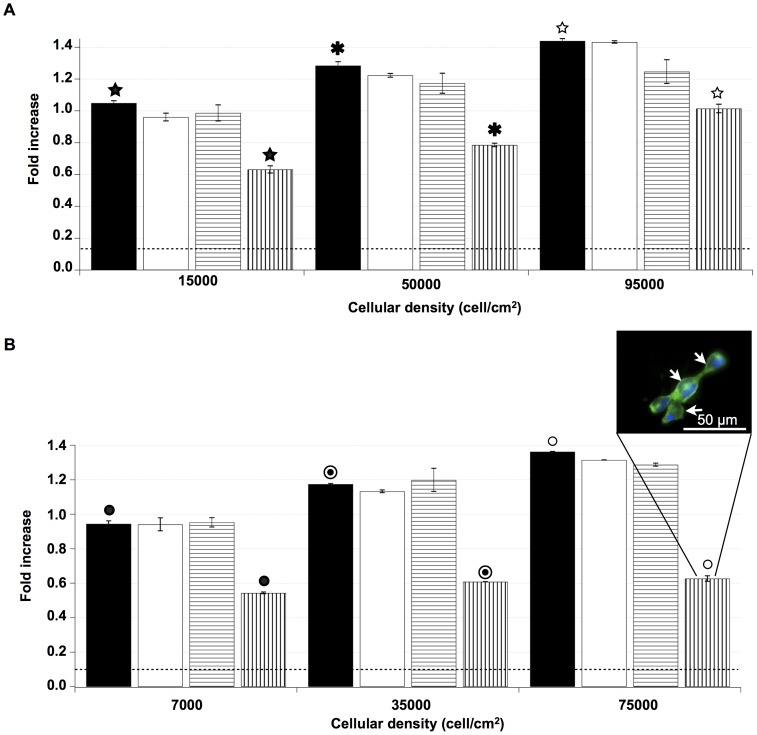
Figure 4. Cellular density effect on endocytsis pathways of E-[c(RGDfK)2] and iRGD.
U87 cells were incubated with E-[c(RGDfK)2] at different densities (15000; 50000; 95000 cell/cm2) (A) or iRGD (7000; 35000; 75000 cell/cm2) (B).These densities were defined as low, medium and high density, respectively. Incubations were performed without inhibitor (▪), with nystatin (□), with amiloride ( ) or with chloroquine (
 ). Results observed after either nystatin or amiloride incubations were not significantly different for all the densities. After chloroquine treatment, significant decreases of E-[c(RGDfK)2] uptake were presented at low, medium and high density (39.8%±2.6%; 38.8±0.8%; 29.5%±2.4%, respectively). Significant iRGD uptake decreases were observed when cells were incubated with chloroquine, 42.4%±1.1% at low density, 48.2±0.2% at medium density and 53.9%±2.5% at high density. The level of autofluorescence of the cells was represented by the dotted line (……). For these experiments (n≥3), the results (☆) and (★,
 ,•,
,•, ○) were significantly different with p<0.05 and p<0.01, respectively. Insert part B, fluorescent microscopy of cells treated with chloroquine, showed a mainly cytoplasmic membrane signal of iRGD (arrows).

