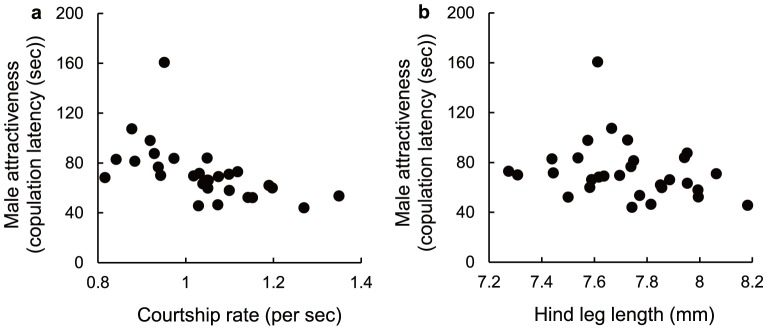
Figure 1. Correlation between male attractiveness and courtship rate and between male attractiveness and hind leg length.

The y-axis is the male attractiveness (copulation latency). The x-axis is the courtship rate (a) and hind leg length (b), respectively. Each circle shows family means for each sire. Increases on the y-axis represent decreased attractiveness.
