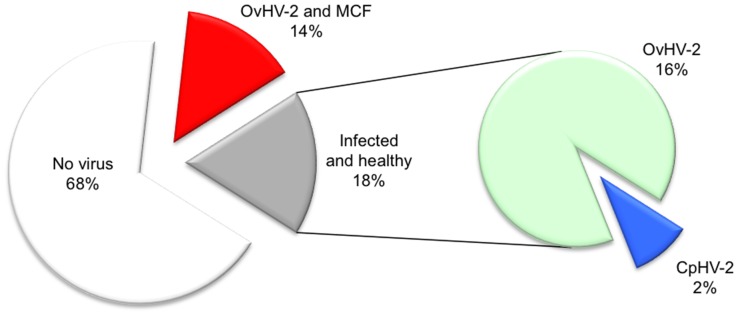
Figure 1. Proportion of Macavirus-affected water buffaloes on farm 1.

Samples from water buffaloes (n = 56) were analyzed by real-time PCR for the detection of OvHV-2 DNA and CpHV-2 DNA, respectively. The figure plots the percentage of healthy animals (“No virus detected”: white; “infected and healthy”: grey) versus the proportion of animals with MCF due to OvHV2 infection (red). In the secondary pie, the proportion of infected but healthy animals is further subdivided into animals with OvHV2 (green) and CpHV2 (blue), respectively.
