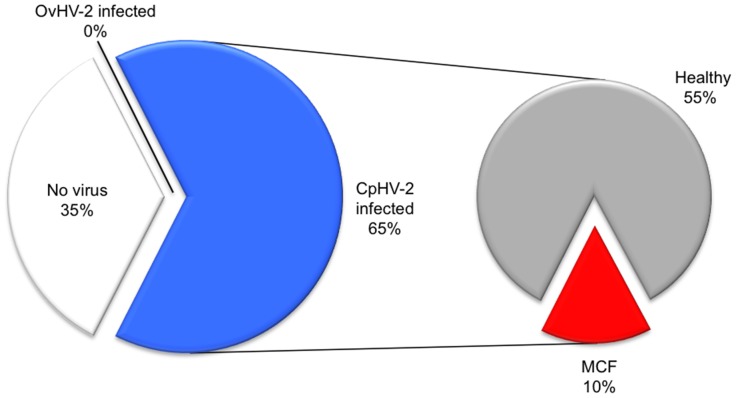
Figure 2. Proportion of Macavirus-affected water buffaloes on farm 2.
Samples from water buffaloes (n = 20) were analyzed by real-time PCR for the detection of OvHV-2 DNA and CpHV-2 DNA, respectively. The figure plots the percentage of virus-free (“No virus detected”: white) and virus-infected animals (“OvHV2 infected”: black; “CpHV2 infected”: blue). In the secondary pie, the proportion of CpHV2-infected animals is further subdivided into animals with MCF (red) and healthy individuals (grey).

