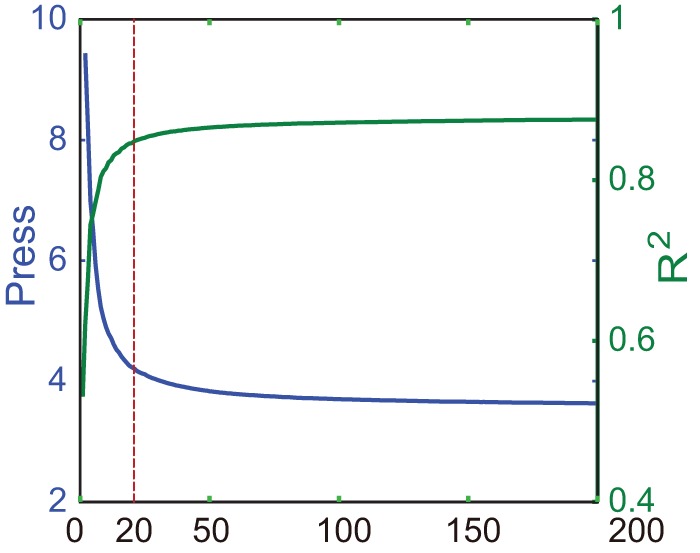
Figure 3. Predictive error sum of squares in model training for monkey B.

The blue line and green line show predictive error sum of squares (PRESS) and R2 values, respectively, for different numbers of latent variables used in the PLS model. The optimal number of 20 is denoted with the red dotted line.
