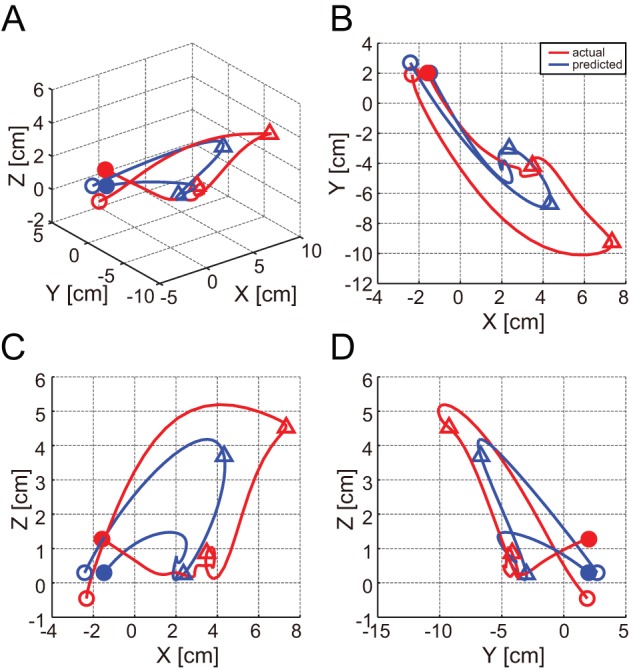
Figure 5. Decoding results for monkey B in three dimensional space.

A) Example of 3D hand trajectory prediction for one trial movement using 32 channel ECoG signals. The predicted and observed trajectories in 3D space are depicted in blue and red, respectively. The unfilled circles represent the start point of movement. The two triangles mark hand position at equivalent time points during movement. Solid circles denote the end point of movement. B, C, and D) The predicted (blue) and observed (red) trajectories shown in the X–Y, X–Z, and Y–Z planes, respectively.
