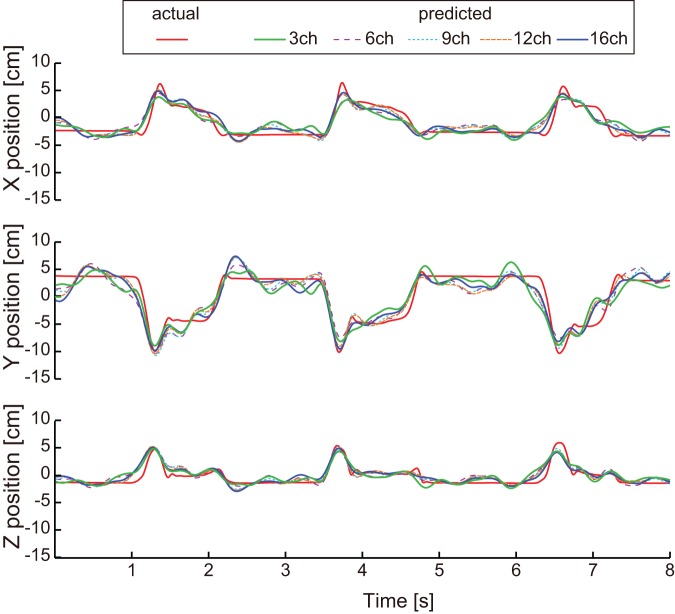
Figure 6. Decoding results for monkey B with different electrode numbers selected using the location-based method.
Example prediction of 3D hand positioning over 8 s of test data using 3, 6, 9, 12, and 16 electrodes. The red solid line depicts actual trajectories. The green solid line, purple dotted line, light blue dotted line, brown dotted line, and blue solid line represent predicted trajectories using 3, 6, 9, 12, and 16 electrodes, respectively.

