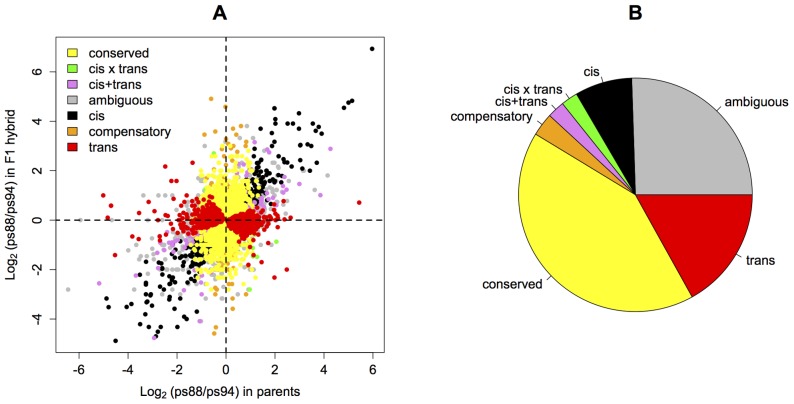
Figure 2. Cis- and trans-regulatory differences.
A) Distribution of regulatory effects depending on parental expression and allele specific expression in the hybrid. B) Relative distribution of the regulatory types (cis: 604 (7.9%); trans: 1292 (16.9%); cis–by–trans: 176 (2.3%); cis+trans: 183 (2.4%); compensatory: 242 (3.2%); conserved: 3187 (41.8%); ambiguous: 1947 (25.5%)).

