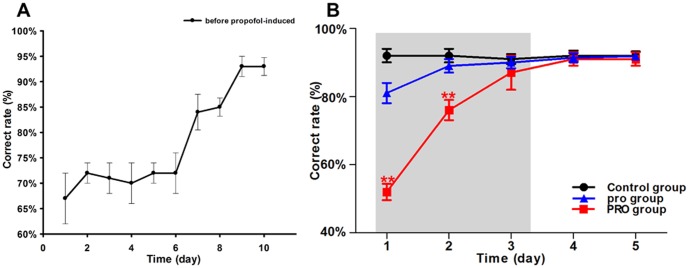
Figure 2. Behavioral results of rats Y-maze performance.
(A) Average correct rate of SD male rats before propofol anesthesia, from the 7th day, the correct rate was above 85% in three consecutive days; (B) Average correct rate after propofol anesthesia. Black line indicate control group averaged correct rate, red line indicate PRO group and blue indicate pro group. In the first 2 days, the difference is obvious between three groups, in the last 3 days, the inhibition of propofol was disappearing (** p<0.01). Error bars represent standard error. Control = no propofol anesthesia; pro = 0.5 mg•kg−1•min−1, 2 h; PRO = 0.9 mg•kg−1•min−1, 2 h.

