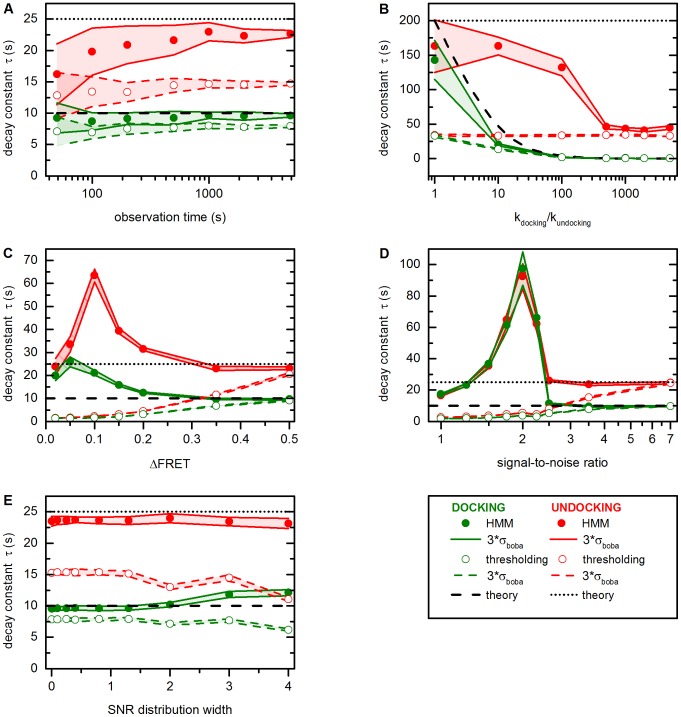
Figure 5. Robustness of thresholding and HMM approaches to analyze smFRET data performed in conjunction with bootstrapping (method 1, kinetics).
Simulated data for a two-state system as defined in the methods section. (A) Performance in response to trace length. Cross-sample variability decreases at long observation times, since the number of dwell times increases. (B) Performance in response to the ratio of rate constants. Two problems bias threshold- and HMM-based analysis: (i) false FRET transitions stemming from noise and (ii) irresolvable FRET transitions. (C–D) Performance in response to FRET spacing and SNR. A systematic downward bias is observed for threshold-based analysis as the two FRET distributions show increasing overlap. The result of the HMM-based analysis depends on the ratio of false and true dwell times. (E) Performance in response to heterogeneously distributed SNRs. The results of the threshold-based analysis and Gaussian fitting are mostly unaffected by changes in the SNR distribution width. All theoretical values were determined from the input parameters used of the simulations. Error bars (red and green swaths) correspond to the standard deviation estimated by bootstrapping (3σ boba). Please refer to Figure S4 for representative simulated time traces and the text for further details.

