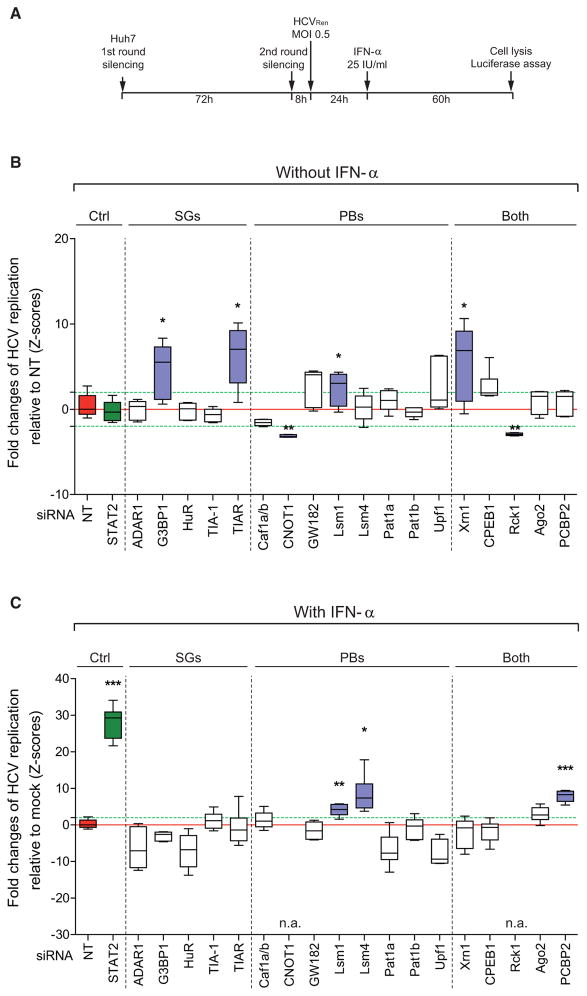
Figure 2. SG Components Promote HCV Replication but Are Dispensable for IFN-α-Mediated Suppression of HCV.
(A) Schematic of the RNAi-based screen set-up to measure rescue of HCV replication in IFN-α treated cells upon knockdown of a given SG- or PB-related gene.
(B and C) Results of RNAi screen. A STAT2-specific siRNA (green box) and a nontargeting siRNA (NT; red box) were included as positive and negative control, respectively. Red and green dashed lines correspond to Z-score = 0 as determined by NT siRNA and to Z-score ± 2, respectively. (B) Boxplots of quantile raw values of HCV replication in absence of IFN-α normalized to cells transfected with NT siRNA. siRNAs leading to an efficient knockdown (Z-score > 2) and a significant change of HCV replication (p value < 0.05) are highlighted with blue boxes. These genes were excluded from the calculation shown in panel (C). (C) Boxplots of quantile ratios between HCV replication in IFN-α treated and untreated cells (mock). Only knockdowns giving rise to a p value < 0.05 and a Z-score > 2 in both calculations (raw values and ratios) were considered as hit candidates. In case of CNOT1 and Rck1, two dependency factors (see B), knockdown and IFN-α treatment reduced replication to nonmeasurable levels and therefore, values could not be determined (n.a., not applicable). See also Figure S3.

