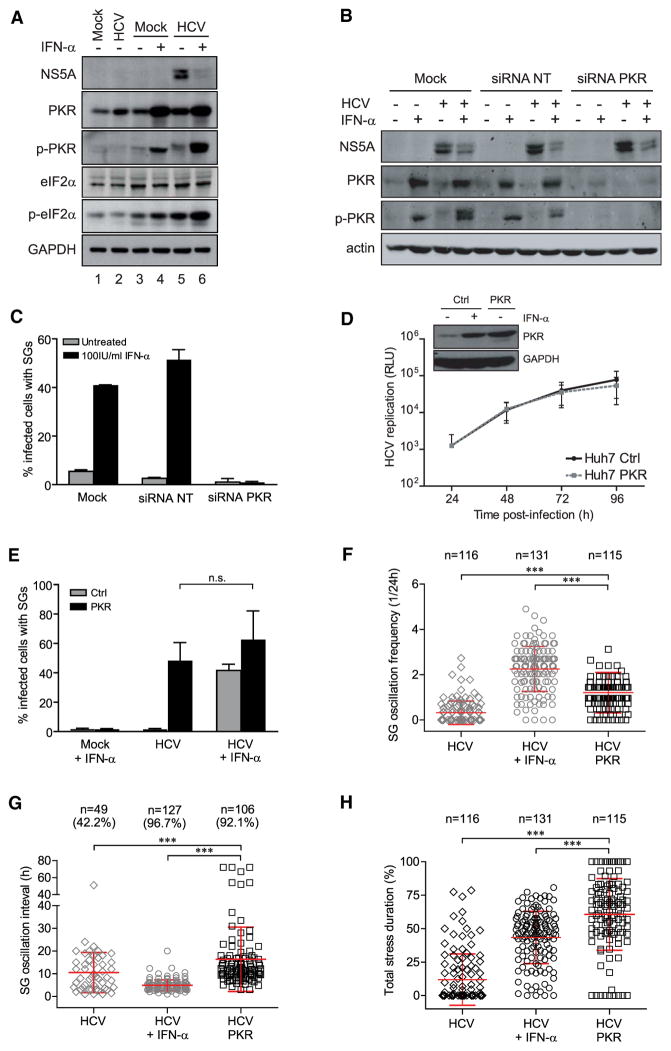
Figure 5. The eIF2α Kinase PKR Is Necessary and Sufficient to Induce SG Formation in HCV-Infected Huh7 Cells.
(A) Western blot analysis of cells infected with HCV for 24 hr (lane 2) or cells infected for 24 hr and cultured for 18 hr in the presence (lane 4, 6) or absence of IFN-α (lane 3, 5). Naive cells cultured for 24 hr in parallel were used as reference (lane 1). (B and C) Transient silencing of PKR in Huh7 YFP-TIA1 cells. Cells were transfected without siRNA (Mock), with nontargeting siRNA (siRNA NT) or with PKR-specific siRNA (siRNA PKR). Twenty four hours later cells were infected with HCV for 24 hr and treated or not with IFN-α for 18 hr. (B) Western blot analysis. (C) Cells were fixed, stained for NS5A, and analyzed. Shown are the mean values ± SD from three independent experiments with at least 100 cells analyzed each.
(D and E) Overexpression of PKR in Huh7 YFP-TIA1 cells. (D) Upper panel: Western blot analysis of Huh7 YFP-TIA1 control cells (Ctrl) treated or not with 100 IU/ml IFN-α for 18 hr or Huh7 YFP-TIA1-PKR cells. Lower panel: characterization of HCV permissiveness of Huh7 YFP-TIA1-PKR cells. Cells were infected with a HCV Renilla luciferase reporter virus, lysed at different time points post-infection and luciferase activity was measured. HCV replication was normalized to the 4 hr values to correct for transfection efficiency (RLU, relative light units). (E) Quantification of HCV-induced SGs in Huh7 YFP-TIA1-PKR cells. Cells were infected with HCV for 24 hr and subsequently treated or not with IFN-α for 18 hr. Cells were fixed, stained for NS5A and analyzed. Shown are the mean values ± SD from three independent experiments with at least 100 cells analyzed each.
(F–H) Scatter plots of SG oscillation frequency, interval, and total stress duration from randomly selected HCV-infected Huh7 YFP-TIA1-PKR cells. Shown in red are mean ± SD. Statistical significance and the number of analyzed cells (n) are given in the top. HCV results (gray symbols) are shown as reference. (F) SG oscillation frequency in HCV infected cells. (G) SG oscillation interval in HCV-infected cells. Number of analyzed cells (n) and corresponding percentage of the total population showing oscillating SGs are given in the top. (H) Total stress duration (i.e., the ratio between total stress time and the observation period for an individual cell) in HCV-infected cells is given in percent. See also Movie S3.

