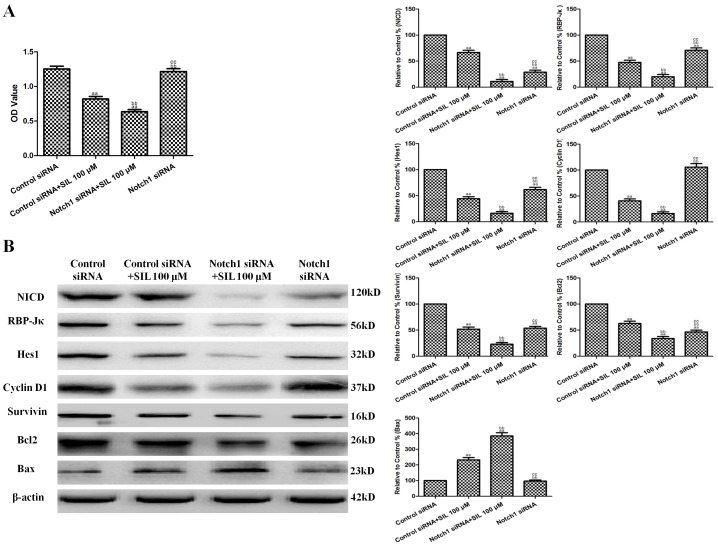
Figure 6. Effects of combined SIL treatment and Notch1 siRNA transfection on cell viability and Notch1 signaling in HCC cells.
A. Viability is expressed as OD values. B. Representative Western blot results are shown. The results are expressed as the means ± SEM, n = 6. aaP<0.01, compared with the control group, bbP<0.01, compared with the 100 µM SIL-treated group, and ccP<0.01, compared with the Notch1 siRNA-transfected +100 µM SIL-treated group. SIL, silybin. OD, optical density.

