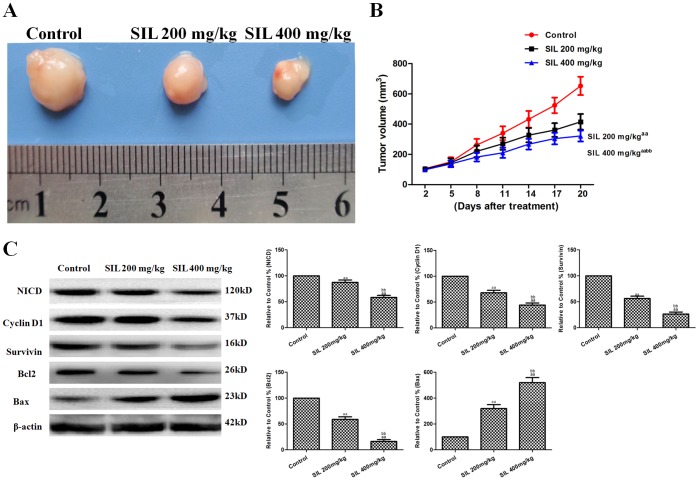
Figure 8. Effects of SIL on HepG2 tumor xenografts in vivo.
Photographs showingtumor xenograft morphologies in the various groups. B. A tumor growth curve was drawn from the tumor volumes and the treatment duration. C. Representative Western blot results are shown. The results are expressed as the means ± SEM, n = 6. aaP<0.01, compared with the control group; bbP<0.01, compared with the SIL200 mg/kg group. SIL, silybin.

