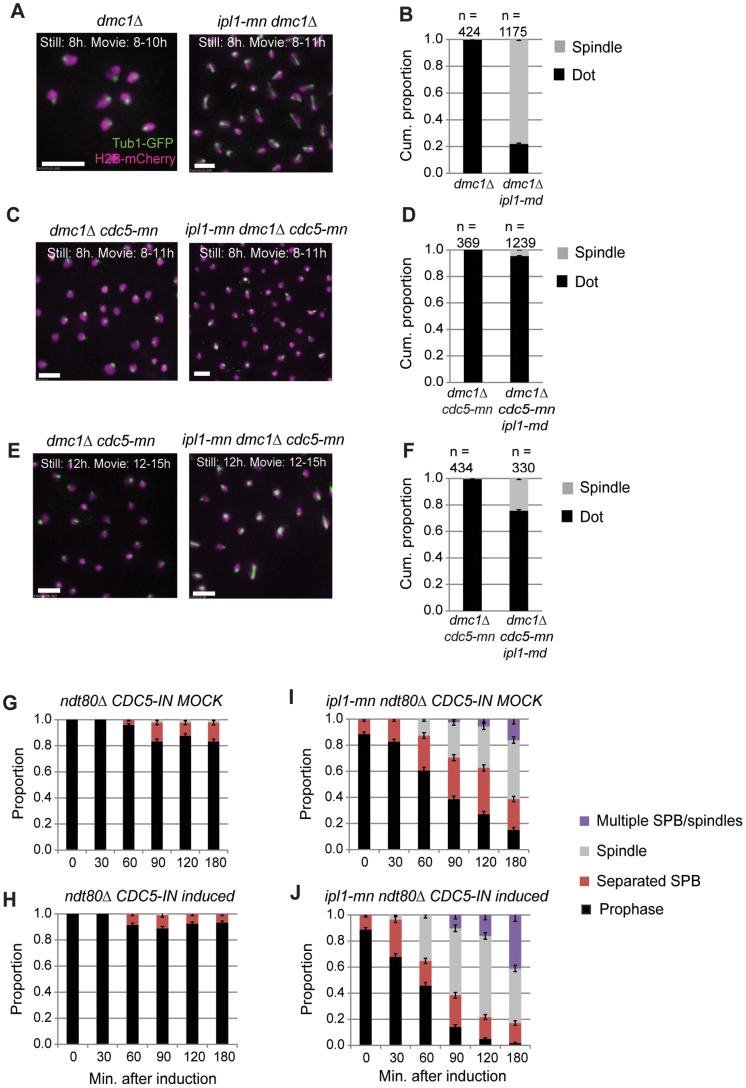
Figure 8. Meiotic depletion of Cdc5 causes delayed spindle formation in ipl1-md cells.
(A,B) Examples of spindle formation (Tub1-GFP) and nuclear dynamics (H2B-mCherry) in dmc1Δ (Y4301), ipl1-mn dmc1Δ (Y4304). Bar: 5 µm. The cumulative proportion of cells forming spindle structures during the time lapse are shown in the graph to the right (B). (C,D) Examples of spindle formation (Tub1-GFP) and nuclear dynamics (H2B-mCherry) dmc1Δ cdc5-mn (Y4405; Movie S6), and ipl1-mn dmc1Δ cdc5-mn (Y4398; Movie S9–10). The cumulative proportion of cells forming spindle structures during the time lapse from 8–11 hours are shown in the graph (D). (E,F) Examples of spindle formation (Tub1-GFP) and nuclear dynamics (H2B-mCherry) dmc1Δ cdc5-mn (Y4405; Movie S11), and ipl1-mn dmc1Δ cdc5-mn (Y4398; Movie S11–12). The cumulative proportion of cells forming spindle structures during the time lapse from 12–15 hours is shown in the graph (F). (G, H) Population dynamics of SPB separation and spindle formation in prophase I arrested cells (ndt80), where mock-treatment (K) or induction of CDC5 (L) occurred. CDC5-IN (PGAL1/10-CDC5 GAL4.ER has been described previously (Souranajan and Lichten, 2008; Jordan et al. 2009) and strains also carried a wild-type copy of CDC5. (I, J) Population dynamics of SPB separation and spindle formation in prophase I arrested cells with Ipl1 depleted (ipl1-md ndt80), where mock-treatment (D) or induction of CDC5 (E) occurred, as in (K,L).

